NFL public betting trends, consensus picks, and money percentages are betting terms often thrown around, but what do they actually mean?
In short, they are terms to describe where the public is placing their money on NFL games. Public betting trends often impact line movements and betting strategies.
In this guide, we'll discuss NFL betting trends and how you can use them to your advantage.
What Is NFL Public Betting?
NFL public betting shows the percentage of bets on each team or outcome. It's a simple stat that pegs where most bettors are placing their money.
Take Kansas City vs the Buffalo Bills, for instance. If 80% of wagers are on the Chiefs to cover the spread, public betting heavily favors Kansas City.
The data comes from legal sportsbooks that track every wager. Leading sportsbooks like DraftKings, BetMGM, and FanDuel share these numbers, which are usually accurate since they handle millions of bets. Some sports media sites combine data from multiple sportsbooks to give bettors an even better idea of the direction of public betting.
NFL Betting Percentages: Bet Percentages vs. Money Percentages
The bet percentage accounts for total bets (or “tickets”), while the money percentage (also known as the “handle”) tracks dollar amounts. The key difference between these NFL public betting percentages lies in what each reveals about betting behavior. A high bet volume but low money volume suggests many casual bettors are backing a team.
For instance, if 75% of bets favor the Dolphins but only 40% of money does, it indicates recreational bettors are taking Miami, while bigger money prefers their opponent.
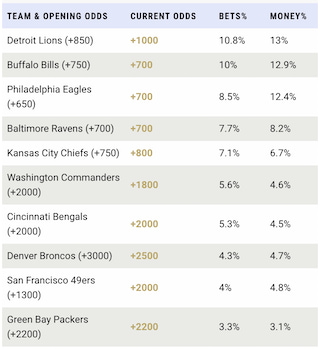
Odds and betting trends at BetMGM accurate at time of posting (Aug 19, 2025)
What Are Bet Percentages?
Bet percentages show the distribution of individual wagers, and not the money amounts. If 70% of tickets are on the Denver Broncos, it means seven out of ten people betting chose Denver to cover. In other words, you are looking at bet volume, detached from the dollar bet amounts.
For example, if 1,000 people bet on a Steelers-Ravens game and 650 picked Pittsburgh, that's a 65% bet percentage for the Steelers. Each bet could be $10 or $1,000, but only the percentage of picks is counted, not bet amounts.
What Are Money Percentages?
On the other hand, money/handle percentages track the total cash wagered on each side. If $1 million is bet on a game between the Bucs and Broncos, and $700,000 is wagered on Tampa Bay, that's a 70% money percentage for the Bucs. This metric often reveals where bigger, potentially sharper money is going.
What Are NFL Public Betting Splits?
Betting splits put bet percentage and money percentage side-by-side for the same game. They provide a complete picture of betting action.
An NFL public betting chart may display splits like this: Jets 65% bets (tickets) / 45% handle (money) vs. Patriots 35% of bets (tickets) / 55% handle (money).
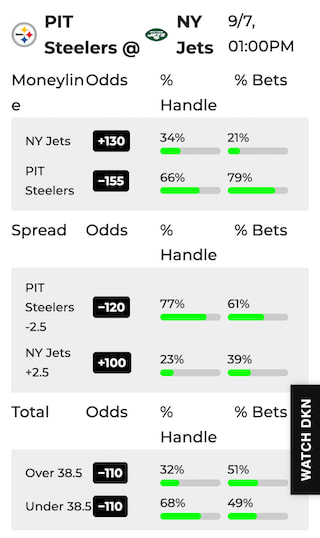
NFL odds and betting trends at DraftKings accurate at time of posting (Aug 19, 2025)
How Public Betting Affects NFL Odds
Sportsbooks adjust lines when betting action becomes lopsided. If 85% of the money is on one side, the books might move the spread to attract opposite action. However, sharp money often influences lines more than public volume, especially early in the week when smart bettors are hunting better closing-line value.
Data-heavy sportsbooks like FanDuel, BetMGM, and DraftKings often dance between risk management and making profits off their sportsbooks. They don't always need equal action on both sides if they're confident in their numbers. When the public heavily backs an overvalued favorite, books might keep favorable lines for smart money on the underdog.
Line movement reveals the ongoing battle between public sentiment and sharp opinion. Early sharp action often sets the direction, while late public money might cause smaller adjustments before kickoff.
How to Capitalize on NFL Public Betting Trends
Smart bettors use NFL public betting percentages as one piece of the puzzle. You want to compare bet and money percentages to spot bias and swoop in. At the same time, you want to track how lines move relative to public money, injury reports, weather conditions, and team form.
Tip #1: Track Line Movements Over Time
Monitor how spreads and totals change from opening to kickoff. Early line movement often shows where sharp money is going, while late movement typically follows public money.
Use line tracking tools to see movement patterns. If a line opens Chiefs -3 but moves to -4.5 despite 70% public money on Kansas City, consider the factors driving the increase.
Tip #2: Compare Bet Percentages and Money Percentages
Look for significant splits between total bets placed and dollar amounts wagered. When 80% of bets back a team but only 45% of the money, casual bettors could be the reason. The reverse suggests fewer, larger professional bets.
Tip #3: Use Data With Other Analysis
Combine public betting trends with injury reports, weather forecasts, and team stats. Public trends alone don't win bets. They work best when supporting or contradicting your other research findings.
Tip #4: Avoid Relying on Public Betting Trends Alone
Of course, the goal isn't to fade the public every time. You want to spot when NFL betting trends squeeze out line value either way.
NFL Betting Trends, Explained
NFL betting trends are slightly different. They track how betting patterns change over time, not just single-game snapshots (think of it as a macro-view). These trends show which teams consistently attract public money and how betting behavior shifts during the season. Unlike public betting percentages, trends reveal longer patterns.
Trends change as the season progresses. Early-season betting often focuses on last year's playoff teams. By mid-season, current form matters more. Playoff contenders see increased public backing, while eliminated teams get less betting action.
What Are NFL Consensus Picks?
NFL consensus gives you the percentage of bettors backing a side in moneyline, spread, or total markets. It combines data from multiple sportsbooks to show overall betting sentiment. Consensus picks spot where the big money is across all bet types.
A strong consensus occurs when the percentage of public bets and public money heavily favors one side. A split consensus happens when the bet and money percentages are misaligned.
Consensus Moneyline Picks
A consensus moneyline pick shows which teams the public is backing to win outright. For example, if 78% of moneyline bets favor the Chiefs over the Chargers, Kansas City is the consensus pick.
Consensus Spread Picks
A consensus spread pick shows which teams the public is backing against the point spread. If 65% of spread bets favor Carolina +7 over the Saints, the Panthers represent the consensus spread pick. Spread consensus often differs from moneyline consensus in close games.
Consensus Totals Picks
A consensus point total pick shows that the public is heavily wagering on the over or the under in a game. If 72% of total bets choose over 47.5 in a Rams-Cardinals game, the over represents the consensus total pick. Weather and game plans can heavily influence these trends.