Measuring future strength of schedule by incorporating prior year win rate is lazy, inaccurate and inefficient. But like most things in the NFL, because it has been an accepted method from years past, there is a strong reluctance to shift from this process. You don't need any math at all to understand this method must be flawed. In the case of 2018 strength of schedule, the traditional method of calculation looks at 2017 W/L of teams to predict 2018 strength of schedule. Seems nonsensical, particularly when you consider the small sample and high variance in a 16-game season. By looking at W/L rate, we intentionally avoid increasing the sample size by rejecting the use of efficiency metrics or average performance on a per play basis. We're ignoring play-level data that could help smooth out performance and instead, we're pulling just one, single number from each game: did the team win the game? A win or a loss.
I can tell you it's pure nonsense, but for the dinosaur generation hung up on accepted behavior, I'll use math to prove that it's nonsense.
Teams change considerably from year to year, particularly from a W/L perspective. With such a small sample size of 16 games, a significant part of a team's overall record is driven by pure chance and luck. Fumble recovery and tipped passes are two major factors in turnover margin, and both are difficult to predict. A close game can hinge on whether one ball gets fumbled or one pass is tipped instead of caught by a WR. Whether the offense recovers the fumble or the tipped pass turns into an interception can alone swing that close game. Teams that win the turnover battle win a staggering 79% of games.
Non-offensive touchdowns are major factors as well, and that doesn't include just special teams touchdowns. A game can swing on a DB after he intercepts a pass at his own 30 yard line: is he tackled immediately or does he evade the tackle and return it 70 yards for a touchdown? Teams that win the return touchdown margin win 75% of the time.
These factors play major roles in winning games and thus, a team's end of season record. But they are not descriptive of a team's strength.
I measure strength of schedule in a variety of ways at Sharp Football Stats. You can visit the site and see strength of schedule for teams across 30+ metrics. Such as which offense faced the weakest defenses against RB-passes, or which defenses faced the worst offenses at explosive passing.
In such a small sample size sport, context is king in the NFL. And a W/L record from the prior season is devoid of all context. It literally has zero context. Which is why, for instance, when sports books look to hang regular season win totals for the next season, the very first thing they look to do is attempt to add context to a team's prior year record. “This team won 5 games last year, but they were 1-6 in games decided by one score and they lost the turnover battle by 2+ turnovers in 4 of their other games. Their starting QB was injured in week 4 and he missed the remainder of the season.” And on and on. Building context to understand why the team went 5-11, and understanding how that same team might look totally different the next season, is vital for projecting future performance from a W/L perspective.
When mainstream websites post stories this time of year about strength of schedule, they are taking their reader down a dead end path with two stops:
1) The first stop is the schedule itself. They list all of the teams and the W/L percentage of their future opponents using those opponent's prior year records. And then they rank the schedules, from hardest to easiest. Their goal is to showcase which teams have the “toughest” schedule the next year. That's their first stop.
2) Their second stop is forecasting success or failure the next season because of the strength of schedule. They will look to the extremes of the strength of schedule, and imply that it will be really hard for the teams with the toughest schedule to do well the next year. And the teams with the easy schedules are set up for a lot of success.
So let's take a swipe at each of those two stops. First, let's examine whether or not the traditionally used offseason strength of schedule comes anywhere close to helping predict actual strength of schedule for that next season. We'll do this by comparing prior year W/L rate of a team's opponents (the “traditionally used strength of schedule calculation”) to the actual W/L rate of the team's opponents in that upcoming season, to see if those two metrics are closely related. If they are, it's legitimately a good method to forecast strength of schedule. If they are unrelated, it's worthless. [We'll stay basic and ignore that even same-season W/L record is an inaccurate way to determine strength of schedule, and efficiency metrics are far superior.]
Then, let's examine whether the traditionally used strength of schedule can help explain team success the following year. Do teams that have tough schedules (based on the traditional method of calculation) actually fare worse, and if so, how much worse than the teams with easier schedules?
Does the Traditionally Used Strength of Schedule Calculation Help to Predict Actual Strength of Schedule?
This should be the first question any writer asks when tasked by their boss to write an article on strength of schedule. [Let's assume their boss doesn't know any better, and just wants *CLICKS* from *CONTENT*.] The entire point of “forecasting” strength of schedule before the season is the hope and belief that this calculation will be close to reality. Using 2018 as an example, there must be a belief from the writer that the W/L rate of teams from 2017 will be somewhat similar to what they actually are in 2018, so that such an calculation has merit. If the 2017 W/L rate of opponents is nothing like the actual 2018 W/L rate of opponents, what is the point? [Apart from *CLICKS* from *CONTENT* obviously.]
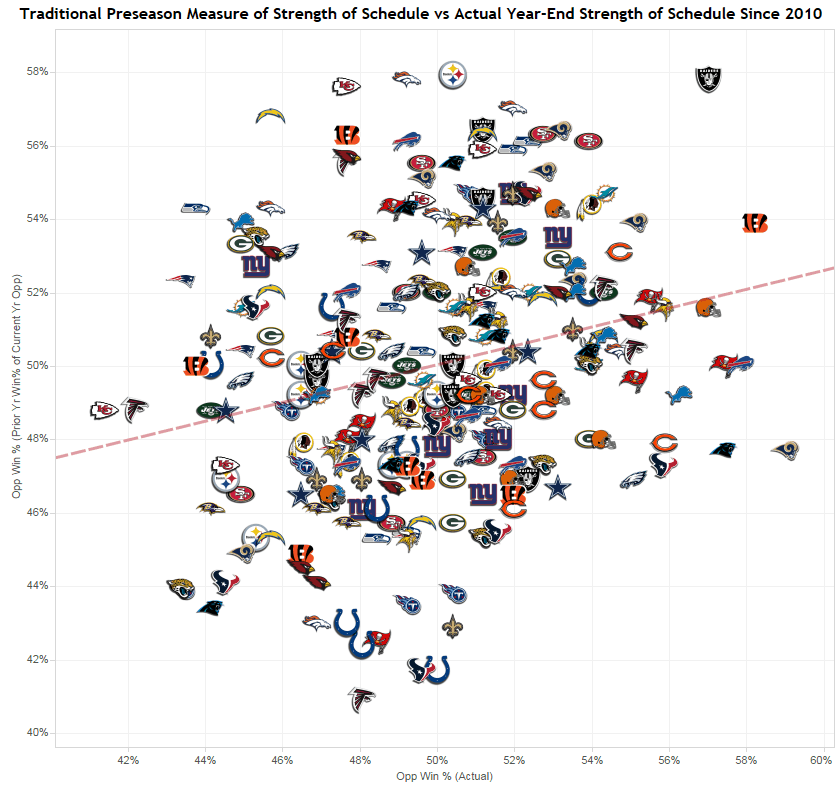
The exercise is pretty simple by use of linear regression. How much of the actual W/L rate of a team's future opponents is explained by the W/L rate from the prior year for those same opponents? Using data since 2010, the answer is 5.7%. If we define strength of schedule as opponent's combined W/L rate (the traditional method), only 5.7% of a team's actual strength of schedule is explained by the W/L rate from the prior season. The other 94.3%, the vast majority, is not explained by that prior season W/L rate at all. The p-value is acceptable (0.0001) but the R-squared is only 0.057. Here is the plot of this data since 2010:
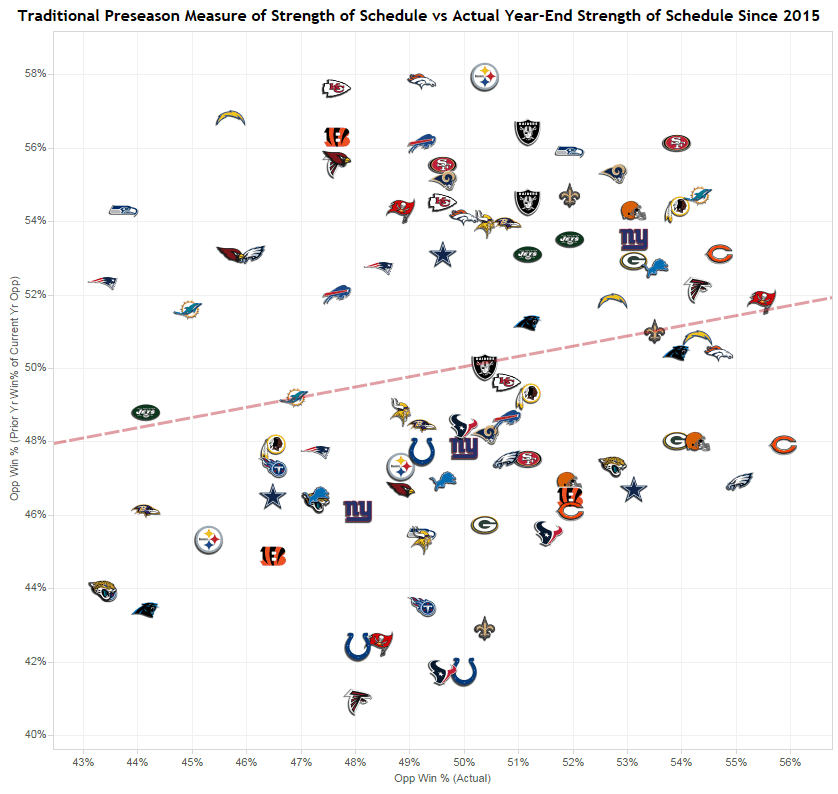
If we shrink it down to just the last three years, we find the p-value has moved to slightly outside acceptable range (0.055) and the R-squared was much worse, down to 0.039. Meaning just 3.9% of the team's actual strength of schedule is explained by the W/L rate from the prior season. Visually, it is easy to see the lack of a meaningful relationship by how far the logos are spread out vertically:
The null hypothesis is that the traditional offseason measure of strength of schedule DOES NOT help to predict actual strength of schedule in that season. And we cannot reject the null hypothesis – traditional strength of schedule simply isn't predictive at all.
Can the Traditionally Used Strength of Schedule Calculation Help to Predict Successful or Unsuccessful Seasons?
This is the second stop. Most articles take the leap that because a certain team has a really tough strength of schedule, that team may struggle to win games. And the opposite is true as well; easier schedules should result in more successful seasons.
Let's pretend that we didn't run the first test above. Let's pretend that we still believe the traditionally used strength of schedule is acceptable and beneficial to showing real strength of schedule for the upcoming season. Testing this hypothesis is done in a similar manner via linear regression. And we will test to see how much of a team's actual wins are explained by the traditionally used strength of schedule calculation.
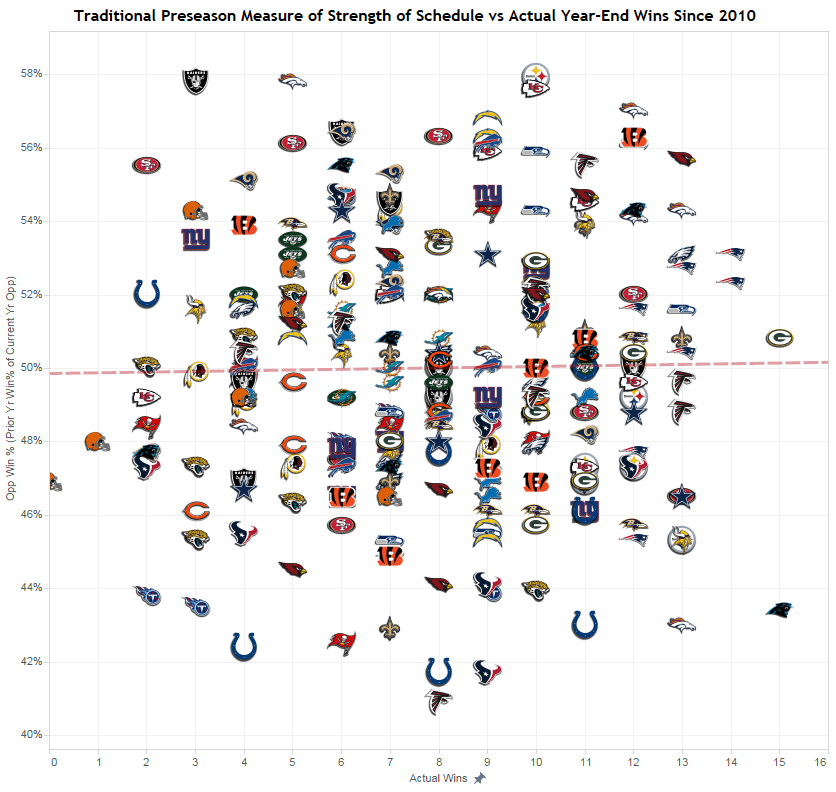
The results are terrible to say the least. The R-squared value is 0.00028, which means that 0.028% of a team's wins are explained by the traditional strength of schedule calculation. In addition, the p-value is totally unacceptable (0.79). Let's see how this looks graphically:
By examining the trend line, it is apparent that it actually trends upwards ever so slightly. Meaning that teams with a tougher schedule actually are winning more games. In other words, there is an inverse relationship between traditional strength of schedule and actual wins. How could this be? It hinges around the fact that the best teams each year are given “slightly” more difficult schedules the next year. At least, that is how it is designed to work. The truth is, where a team finishes in the prior season changes only two games on their schedule for the next season. Here is how the 16 games are determined, and let's use the Patriots as an example, the team that finished in first place in the AFC East:
- 6 games against a team's own division (AFC East)
- 4 games against an entire division within your own conference (AFC North, West or South – let's assume the AFC North for this example)
- 4 games against an entire division outside your own conference (any division from the NFC)
- 2 game against similarly placing teams in divisions within your conference (since NE finished in first, they play the first place team in the AFC West and AFC South, as they already are playing the first place team in the AFC North by virtue of the second bullet)
So in reality, the “best teams” from the prior year only have to play 2 opponents based on those opponent's prior year division finish. And it's therefore very possible that the “best teams” from the prior year will win many games the following season even if they are playing what calculates (using the traditional method) to be a tough schedule.
It's not until we shrink the sample down to the last two years that we see the trend line return to a relationship which suggests that the tougher strength of schedule results in fewer wins. However, the results are still completely unacceptable. The R-squared is 0.0019 and the p-value is 0.73, as illustrated below. Both teams who made it to the Super Bowl this year played much more difficult schedules than average, and the Super Bowl winning Patriots from 2016 did as well. On the opposite end of the spectrum, the 2017 Bengals played the 4th easiest schedule of the past two years and didn't even hit .500.
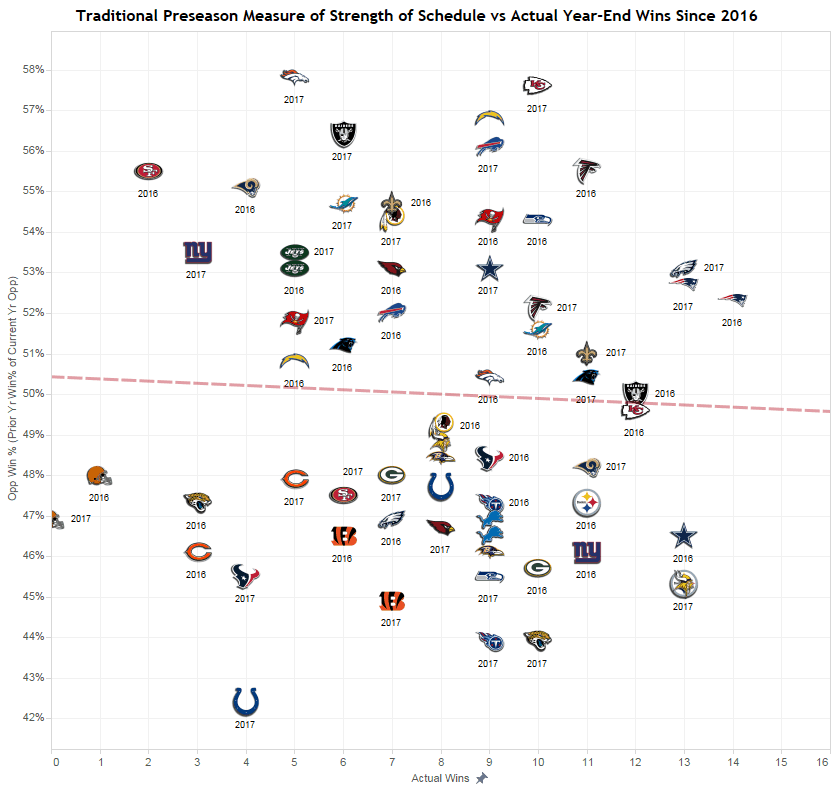
The null hypothesis that the traditional offseason measure of strength of schedule DOES NOT help to predict successful or unsuccessful seasons. And we cannot reject the null hypothesis – traditional strength of schedule doesn't predict anything related to future success.
Please Stop Using Offseason Strength of Schedule Information
It is totally unhelpful. It does NOT help to predict actual strength of schedule for the upcoming season. And it especially does NOT help to predict that a tough schedule (by its own formula) will result in fewer wins or an easier schedule will result in more wins. I completely understand the desire to discuss the NFL. But discussing strength of schedule in this manner is just foolish.
Unfortunately, I can't tell you how many times you will see strength of schedule for the 2018 season based on opponent's 2017 W/L results. Between now and July, you will see hundreds of articles published on this subject. You will hear it discussed on countless radio shows. You will see graphics packages built and thrown up repeatedly on mainstream NFL programming. It will be unavoidable. And I shudder to think of the tweetstorm that we'll be inundated with related to the traditional calculation of strength of schedule.
Don't take any of it to heart. Feel free to refer them to this article. I've written about this before and will inevitably do the same in the future. You don't need any math at all to understand this method must be flawed. But sure enough, the math supports that not only is it a tremendous waste of time to study traditional offseason measure of strength of schedule, it is even less meaningful to the prediction of 2018 wins and losses than anyone would think.
If we want to discuss strength of schedule, there are FAR more accurate methods to use for calculation rather than W/L rate, even if it is actual in-season win rate. Readers want to know if their play tough opponents next year. Discussing those teams in an article, with context about those teams and what they may look like in 2018, is vastly superior to the traditional article, which is centered around prior year win rate of current year opponents. I'll certainly spend time this offseason sharing a methodology I've created to best forecast strength of schedule. And it has nothing to do with prior year win rate. But I'll be the first to say, as I always do, that far too much is made of offseason strength of schedule, and far too little is discussed about in-season strength of schedule.
We just finished a season where article after article continued to discuss the “mighty” defense of the New England Patriots, and how they “turned it around” from earlier in the season and played so much better down the stretch run, allowing so few points. This was discussed ad nauseum in the two weeks leading up to the Super Bowl. And there was zero discussion about the fact that the Patriots defense clearly looked better thanks to playing a schedule with just one top-10 offense. And Nick Foles, the Eagles and the #8 offense put up 41 points on this perceived “strong” Patriots defense.
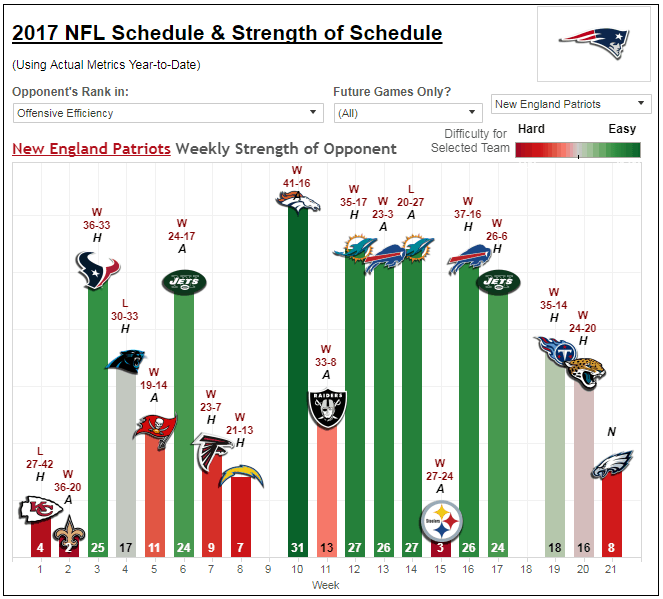
This reiterates my point that too much is made of strength of schedule in the offseason, but the sad part is, it's not even being calculated in a useful manner whatsoever. In typical NFL fashion, much hype is delivered to something that isn't calculated in a manner that correlates to “real” strength of schedule, and very little is made of the most useful and best information (in-season strength of schedule). This should surprise no one.


