• Throws beyond the line to gain consistently convert more first downs
  • Team tendencies don’t align with the numbers 
  • Teams that were more aggressive tended to have higher conversion rates

As data collection has improved over recent years in the NFL, air yards have become a fixture in both player-level and team-level analysis.  In previous research we looked at what air yards can tell us about how teams are behaving in third-and-long situations, and whether or not they are aggressive enough (they’re not). That research focused only on third-and-10+, though. Does the same pattern hold up when looking at all third down attempts?

Air Yards and Third Down Conversions

To handle this, third down attempts are grouped into four buckets by distance to go, and air yards are converted into a plus/minus of sorts in reference to where the sticks are. A throw exactly on the yard to gain would be a zero, two yards would be plus-2 and so on. Using this, we can calculate league-level conversion rates based on how far in front of or beyond the sticks a team throws it.

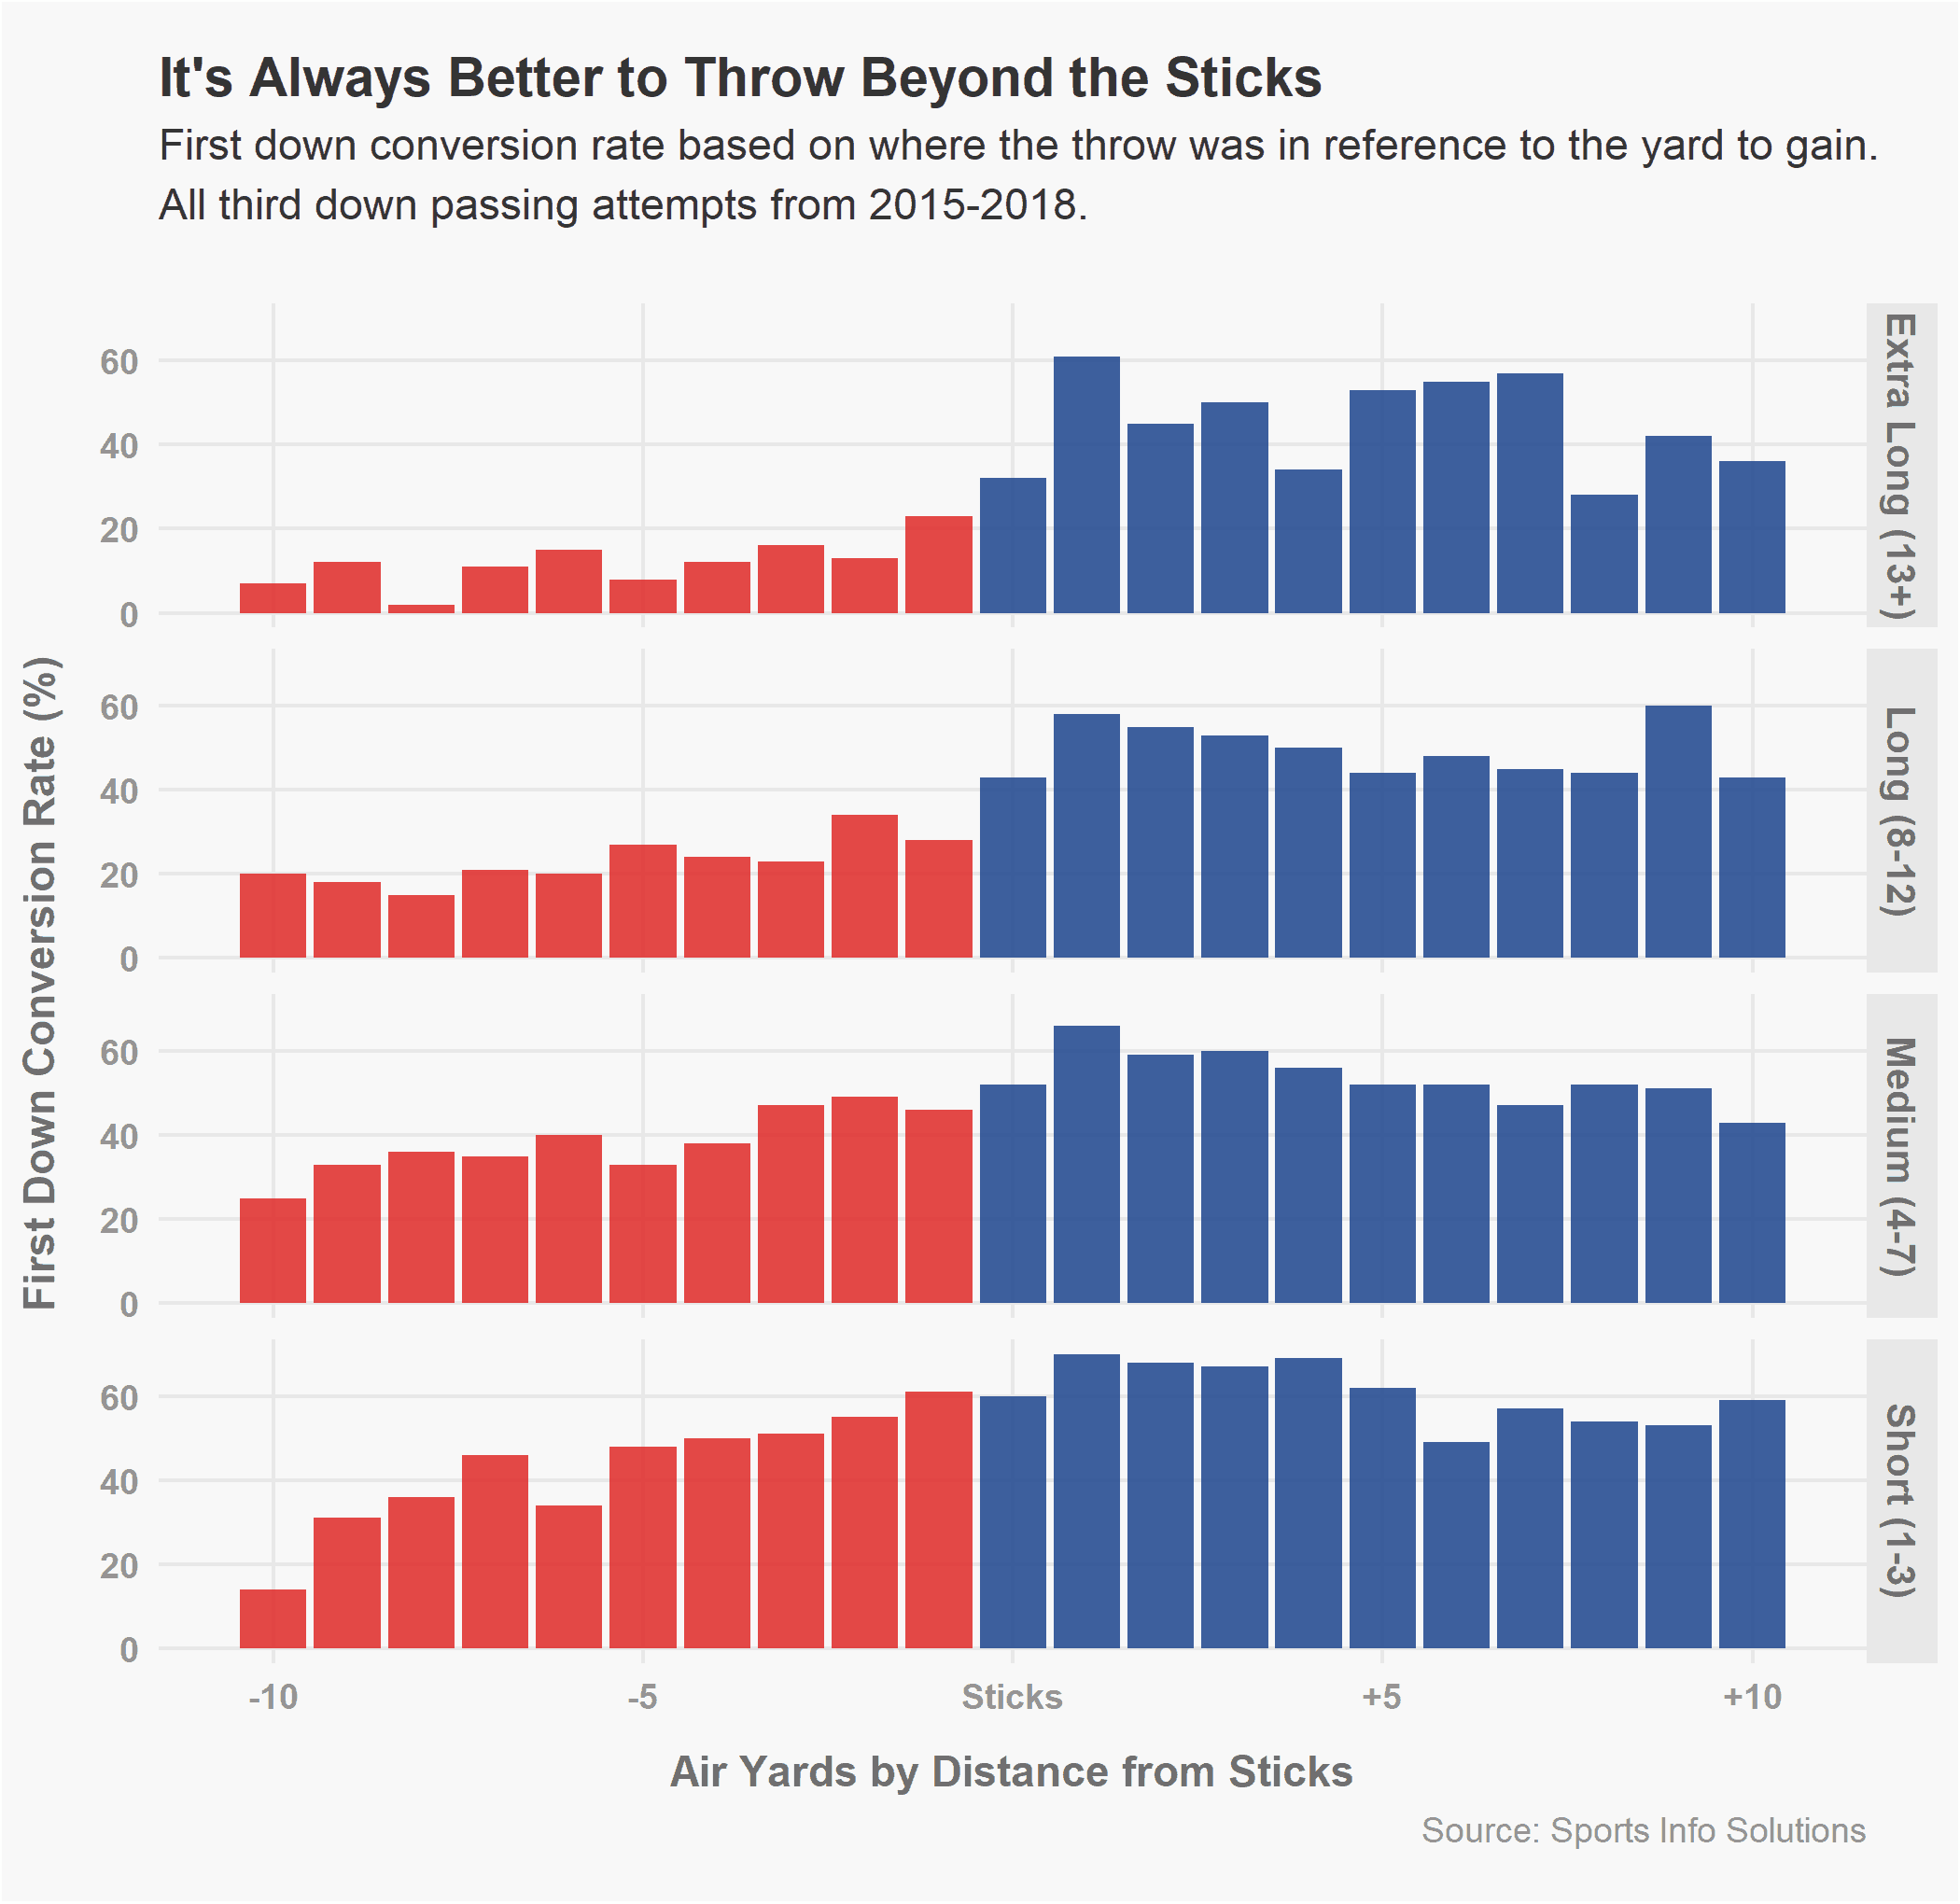
Notably, it is beneficial to push the ball beyond the yard to gain. Regardless of the distance to go, the first down conversion rate on throws that travel at least to the sticks is higher than on throws short of the sticks.

This isn’t a shocking finding. Intuitively, it makes sense that being more aggressive would also tend to lead to more first downs. What might be surprising is that a difference of as little as a yard or two can make a drastic difference, especially in longer down and distances. In third and 13+, the first down conversion rate of throws that were one yard short of the line to gain resulted in a first down about 20% of the time, while throws one yard beyond the sticks resulted in a first down around 60% of the time. The difference of two air yards tripled the likelihood of a conversion.

First Down %Target %
Distance to GoShort of SticksBeyond SticksShort of SticksBeyond Sticks
Short (1-3)51.7%60.3%23.1%76.9%
Medium (4-7)41.2%50.7%52.6%47.4%
Long (8-12)21.7%44.8%66.2%33.8%
Very Long (13+)5.9%38.8%74.4%25.6%

As with most play-calling and decision making, NFL coaches tend to be risk-averse in these situations despite what the numbers say. Even in third and short, teams still threw the ball beyond the sticks on only 77% of attempts. This rate dropped all the way to 26% in third and 13 or longer, and this is despite the conversion rate of throws beyond the sticks in these situations being 33 percentage points higher.

In defense of teams, some of this can be attributed to scheme. In longer down and distance situations, it is much easier for defenses to drop back and take away the deeper portions of the field, making it far harder on the offense to get to its first or even second reads. In all likelihood, the intended depth of many of the plays that resulted in short throws or check downs were designed to get beyond the sticks. But even still, the large disparity suggests coaches are leaving a lot on the table.

Additionally, the most commonly targeted route in these third and 13+ situations was a screen, with more than 100 more targets than the next closest route type. The merits of screen passes in these situations do not need to be discussed at length, but it’s worth mentioning that on average these screens were caught 21 yards behind the yard to gain, and resulted in a first down on only about 6% of attempts.

To be fair, screens aren’t generally thrown in an effort to get a first down, but are more of a concession of downs in an effort to avoid turnovers. But the change in turnover rates when targeting the sticks is not nearly as dramatic as you might expect (only about a 2% increase). 

The next most common route type in third and very long was the curl, which was caught a little more than 8 yards behind the yard to gain on average, followed by the out (minus-6) and drag (minus-13). Check-and-release, chip, and flat routes (the routes most commonly associated with check downs) in total were targeted about half as often as screens. 

Adding Expected Yards After the Catch

The data also suggests throwing just short of the sticks is at least more viable in short yardage situations. A lot of this can be attributed to the type of routes used. Routes like slants, swings, and screens are more valuable and far more likely to convert in short yardage, as compared to routes like curls or comebacks that are more likely to be targeted in third-and-long and tend to leave receivers in positions where it’s tough to create yards after the catch. 

To account for this, we developed our own model for Expected Yards After the Catch (xYAC), which uses the throw depth, route type, and distance to go to determine how many yards a receiver would be expected to gain after the catch.  

When looking at xYAC on throws just shy of the sticks, it becomes more apparent why it becomes increasingly necessary to be more aggressive when you’re behind the sticks. The table below shows the xYAC for throws between one and three yards short of the sticks, grouped by distance to go.

Distance to GoxYAC
Short (1-3)3.3
Medium (4-7)2.2
Long (8-12)1.6
Very Long (13+)1.2

On average, teams can count on a little more than three yards after the catch on throws just shy of the sticks in short yardage situations, but barely more than a yard in third and 13+. This indicates that quick-hitting passes have a lot of value in third and short, and also explains why the disparity in success between throws just shy of the sticks and just beyond the sticks is so great.

Third Down Plus/Minus

How successful teams are on third down no doubt plays a large part in how successful they are offensively, but it is also notoriously noisy and unstable from year to year. Only about 6% of the variability in a team’s third down conversion rate can be explained away using their numbers from the previous season. But this is not necessarily an indication that it is completely random.

Using route types, air yards, and the aforementioned xYAC we can estimate how likely a team is to convert a given third down and calculate a team’s expected success rate. The expected value can also act as an indication of which teams were the most aggressive in these situations, as teams who more consistently pushed the ball downfield or targeted routes that would be expected to get past the sticks will have higher expected conversion rates. 

In total, about 36% of the variability in team’s success rate can be attributed to a combination of air yards and xYAC, which is an indication that while the metric overall is seemingly noisy, a team’s performance in these situations is linked to its decision making in some capacity. 

Third Down Conversion Rate +/- Leaders and Trailers – All third down passes 2018

RankTeamExpectedActual+/-
1Chiefs42.2%54.5%12.3
2Buccaneers41.1%49.2%8.1
3Falcons40.6%48.3%7.8
4Saints41.7%47.5%5.8
5Colts42.7%47.8%5.1
28Dolphins39.7%36.8%-3
29Jets39.7%35.4%-4.3
30Bills38.0%33.1%-4.9
31Cardinals39.1%33.3%-5.7
32Broncos40.4%32.8%-7.6

In general, the teams that were the most aggressive or had the highest expected conversion rates were also more likely to outperform their expectations. The same is true for the trailers. Some of this is undoubtedly personnel related. The bottom 5 from last season included three rookies at quarterback, as well Case Keenum and the combination of Ryan Tannehill and Brock Osweiler. This is a strong juxtaposition to the likes of Patrick Mahomes, Matt Ryan, Drew Brees, and Andrew Luck who find their teams at the top of the leaderboard. It is worth mentioning however the Buccaneers were among the most aggressive and successful teams on third down, and they did so with Ryan Fitzpatrick and Jameis Winston.

Final Thoughts

Overall, NFL teams should at least reduce third down screens and get away from actively throwing the ball short of the sticks in long down and distances. Receivers will not always win their routes, and throws beyond the sticks may not be a legitimate option, but teams need to try and be more aggressive in third downs.