Everybody loves talking about quarterbacks. They play the most important and visible position in American professional sports, after all. As a result, there have been a lot of different metrics created to evaluate them. We started with Wins and have come all the way to metrics using tracking data (e.g. Next Gen Stats’ Completion Percentage Above Expectation).
At Sports Info Solutions (SIS), we’re trying to advance the analytical conversation both within front offices and among fans. So today we’re going to review a handful of metrics you might use to evaluate quarterbacks on a holistic level: where they are useful and where they are limited.
The Progression of Overall Quarterback Evaluation Metrics
Passer Rating
- Created in 1973, available just about anywhere back to circa 1932
- Familiar to fans, and thus easy to evaluate at a glance
- Inputs are straightforward, though the calculation is convoluted
- Weights for different events are outdated
We all know Passer Rating, although not so many people actually understand how it works. It’s been around forever, and we’re still confused as to why the best score had to be 158.3. It was quite valuable in its time because of the limited ways that we had to evaluate any player in the 1970’s, and any all-encompassing rate-based stat was a huge step up. However, its weights were never updated for the modern NFL, so it has become a bit of a dinosaur.
Adjusted Net Yards per Attempt (ANY/A)
- Created in 1988, available back to 1969 on Pro-Football-Reference among others
- Improved weighting of events compared to Passer Rating
- Removes the artificial floor and ceiling that Passer Rating produces
- Scaled to yards per attempt
- Accounts for sacks
With its roots in the 1988 book The Hidden Game of Football by Bob Carroll, John Thorn, and Pete Palmer, ANY/A takes Passer Rating’s value as an overall metric with weights for different events and gives it a more modern and robust flavor. The formula has had some tweaks over time, including splitting off from the original Adjusted Yards per Attempt proposed in Hidden Game by adding sacks. The addition of sacks is actually a huge factor in why ANY/A improves over Passer Rating, as they’re simultaneously a) a critical set of plays in how offenses perform and b) more the fault of the quarterback than most people think.
Independent Quarterback Rating (IQR)
- Created in 2016, available from Sports Info Solutions back to 2015
- Same scale as Passer Rating, for better or for worse
- Removes play results that are outside the QB’s control (e.g. drops, dropped interceptions) or “uncompletable passes” (e.g. spikes, throwaways)
- Does not account for sacks or quarterback runs
One of the first metrics SIS put out once it started charting football, IQR takes the Passer Rating formula and adds in some wrinkles. Dropped passes (by the offense or a would-be interceptor) are treated as though they were caught, with the forgone yards, touchdowns, and interceptions added to the quarterback’s line.
This reduces the stat’s dependence on the performance of players around him. Plays where we can’t glean too much from an evaluation perspective (spikes, throwaways, batted passes, and receiver miscommunications) are removed from the calculation entirely. It is a quick-and-dirty application of charting data on top of a familiar formula, making it a useful way to view quarterback passing performance while keeping the scale that people are used to.
Expected Points Added (EPA) per Play
- Tough to nail down a specific creation date, and by now it is available in a few different places with slightly different calculations, e.g. back to 2009 with nflscrapR and back to 2015 with the SIS DataHub Pro
- Takes into account down, distance, and field location when evaluating a play
- Includes sacks, rushing contributions, and turnover returns
- Evaluates every play result on the same scale, so no defined weights
All of the vagaries of weighting plays and including or excluding certain plays can be avoided simply by using EPA per play. Every play’s value is determined by its effect on Expected Points, not based on any specific formula. If you have the play-by-play data (i.e. via nflscrapR) you can filter out plays by specific criteria, or you can take a quarterback’s full sample of plays and feel confident that every aspect of his action plays will be included. For example, it also includes turnover returns, which means it differentiates between a pick-six on first-and-goal and a hail mary interception just short of the end zone.
Total QBR
- Created in 2011, available back to 2006 from ESPN (deeper explanation here)
- Weights plays by Expected Points Added
- Uses play-level charting to distribute credit
- Able to evaluate passing and rushing contributions
- Accounts for penalties, opponent quality and garbage time
- Efficiency metric scaled from 0 to 100
Total Points Earned
- Created in 2018, available back to 2016 from Sports Info Solutions (deeper explanation here)
- Weights plays by Expected Points Added
- Uses play-level charting to distribute credit
- Able to evaluate passing and rushing contributions
- Part of a system that evaluates all 22 players at once
- Value metric scaled to the player’s effect on point scoring
We’ll take these two in tandem because so many aspects of the two models overlap. Both take the EPA framework and use play-level charting data to divide credit for what happened on the play. EPA per play won’t know the difference between a 50-yard throw and a five-yard throw if both plays ended up gaining 50 yards. Both of these metrics use granular data points like air yards, pressure, and dropped passes to affect how the credit for a result is apportioned.
Total QBR uses slightly fewer inputs than Total Points Earned, largely because it is designed for quarterback evaluation specifically, while the Total Points system evaluates all 22 players on the field at the same time. In addition to the above, the model for QBR gives quarterbacks responsibility for penalties and adjusts for opponent quality and factors in garbage time, although some of those items can be filtered out if desired on ESPN’s leaderboard.
We’d be remiss not to mention Pro Football Focus grades as a potential metric of choice. They come from grading each player on each play individually. However, since those numbers aren’t freely available, we’re leaving them out of this discussion.
For a quick reference on the aspects covered in each stat, see the table below.
| Metric | Pass Attempts | Sacks | Rush Attempts | Charting Data |
|---|---|---|---|---|
| Passer Rating | ✔ | |||
| IQR | ✔ | ✔ | ||
| ANY/A | ✔ | ✔ | ||
| EPA | ✔ | ✔ | ✔ | |
| Total QBR | ✔ | ✔ | ✔ | ✔ |
| Total Points Earned | ✔ | ✔ | ✔ | ✔ |
How Do The Different Stats Compare?
Many of these metrics will give similar results in terms of ranking quarterbacks. For all analysis below, only the top quarterbacks who qualify for the seasonal ESPN Total QBR leaderboard were included. The EPA values come from SIS’s model, so results might vary slightly from other sources. To make the comparison more apples-to-apples, we’ll isolate the passing component of each of the three more advanced metrics.
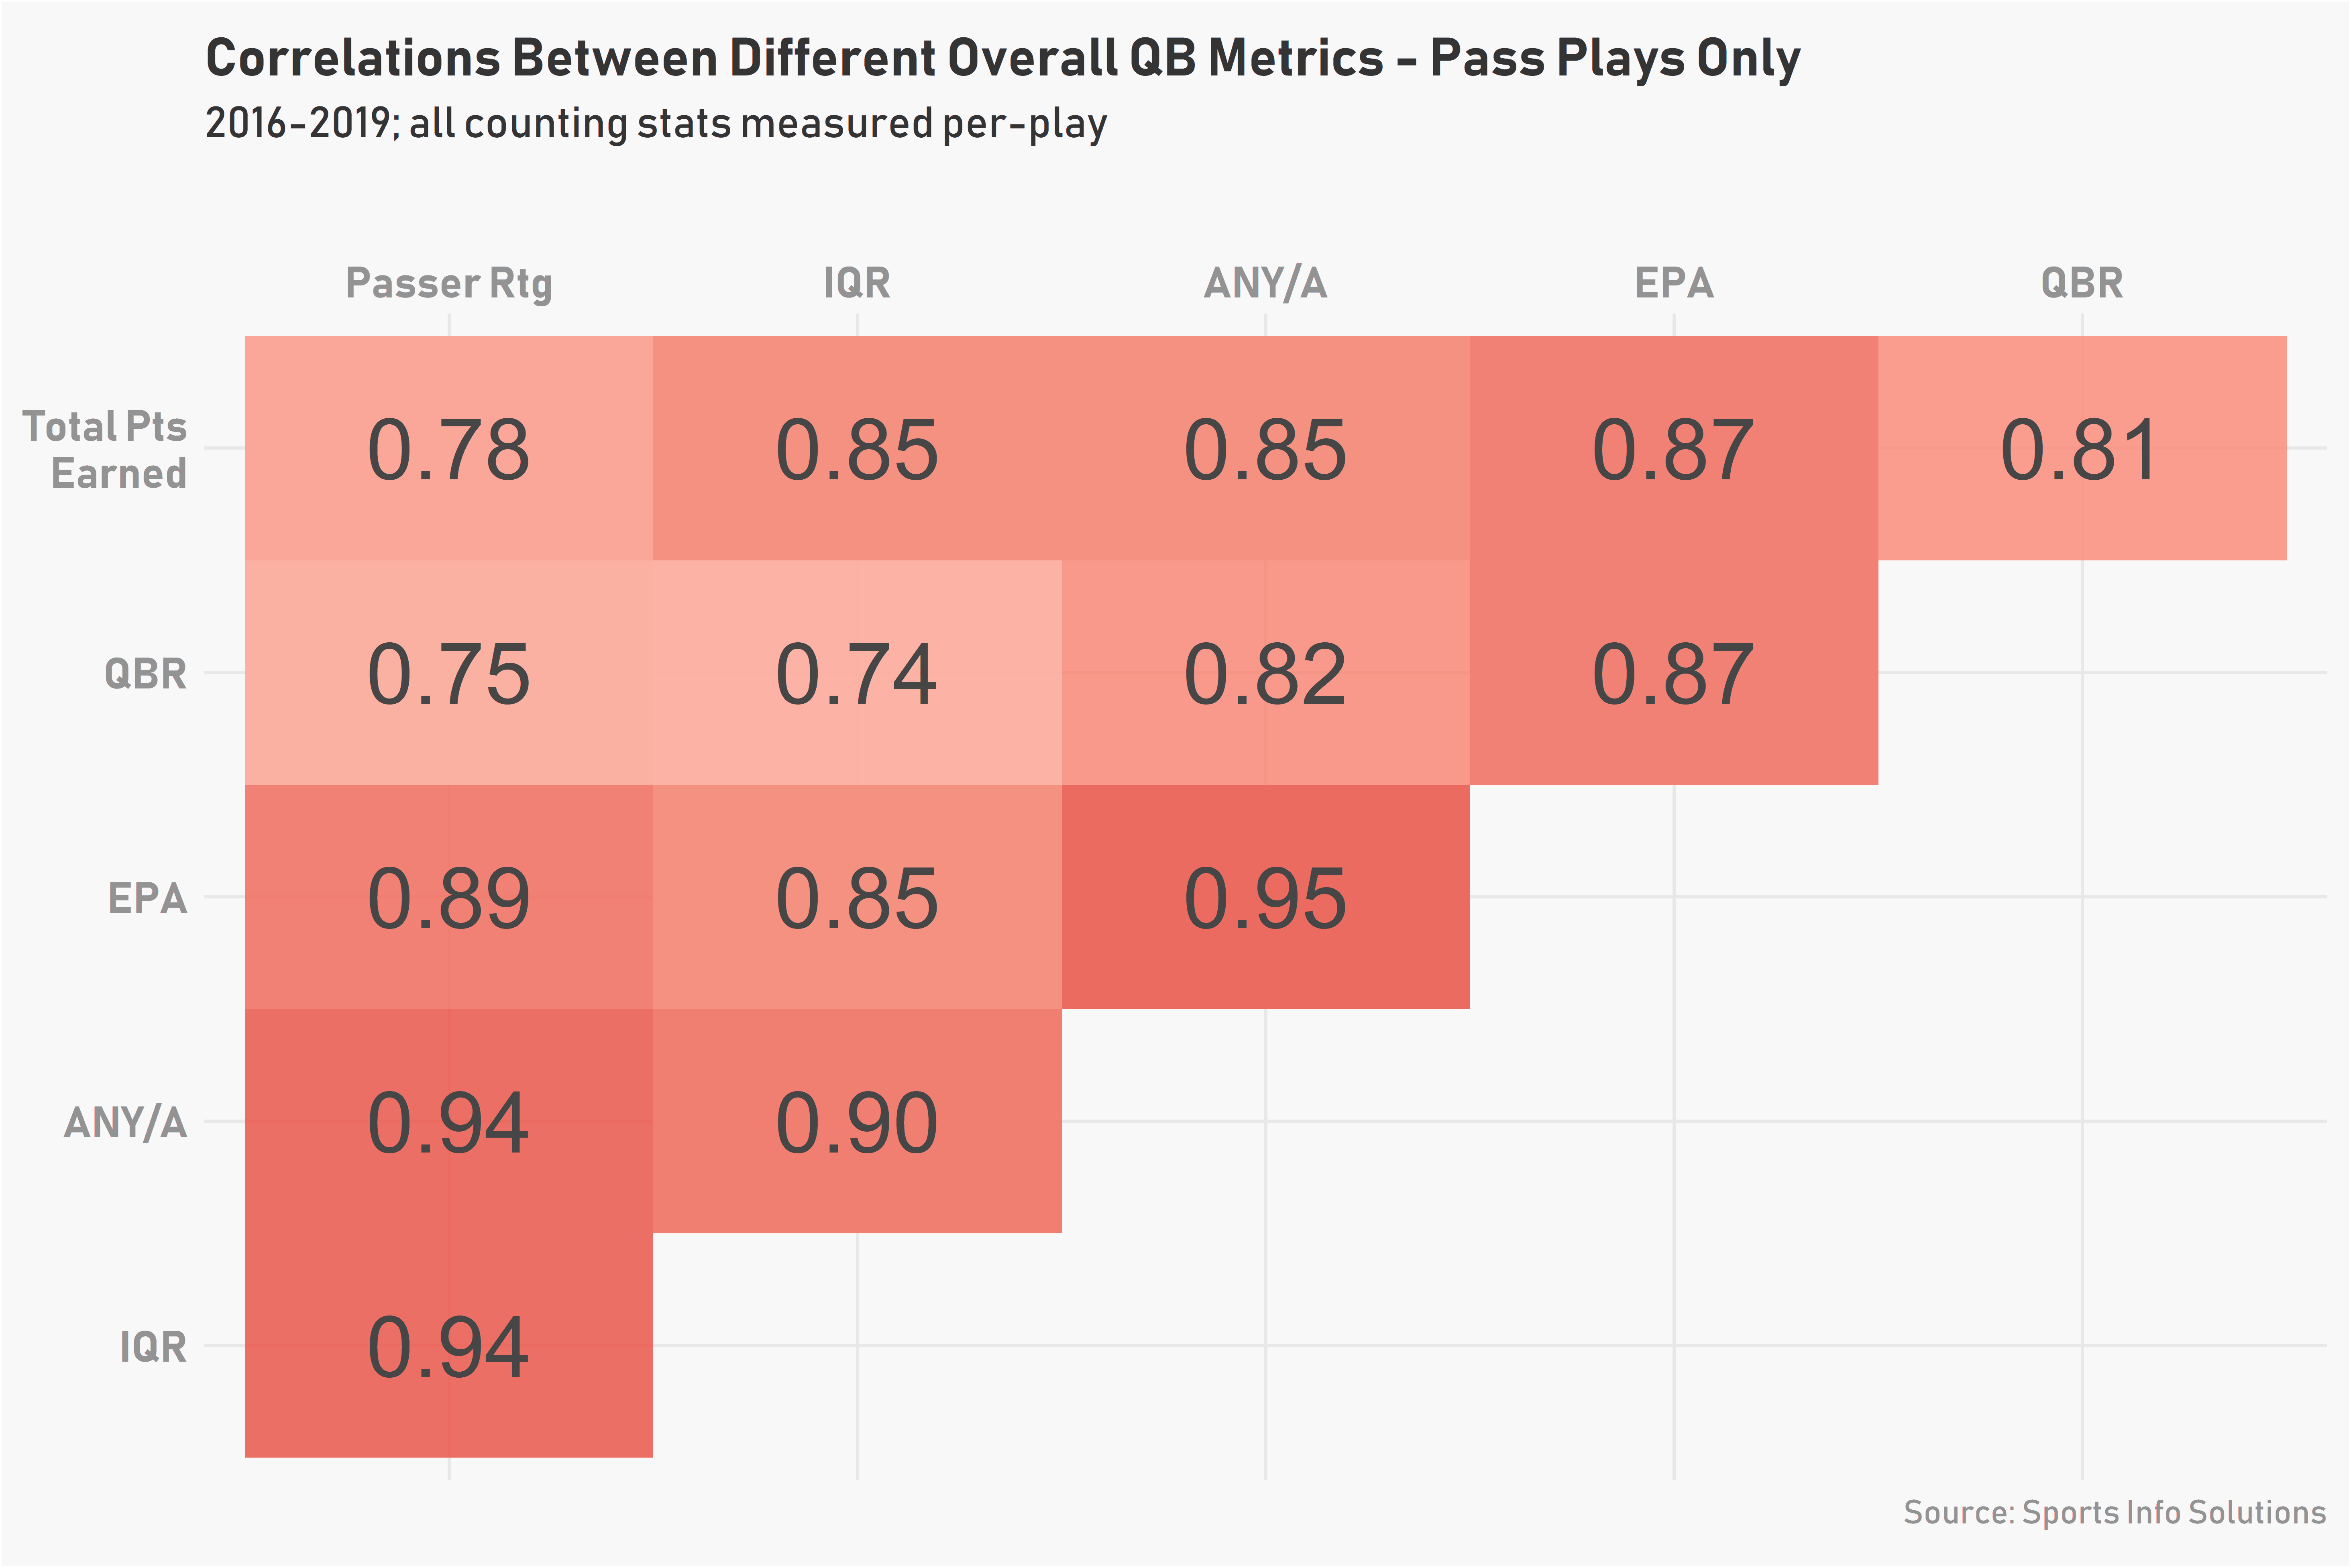
All of the metrics that are either old or based on an older metric (Passer Rating, ANY/A, and IQR) are very closely aligned with each other. From that group, the improved model of EPA aligns most closely with ANY/A, which is due to the inclusion of sacks in both.
If you’d prefer to distance yourself from Passer Rating, both Total QBR and Total Points Earned do the trick, although there’s still quite a bit of agreement, even with the inclusion of sacks and the isolation of quarterback play through charting data. The two division-of-credit metrics are middle-of-the-pack in terms of their alignment with each other.
How reliable are the different metrics? We can look at year-to-year correlations (including the partial 2019 numbers to give an extra set of season pairs, even if they will be a bit noisy).
Year-to-Year Correlations of QB Evaluation Metrics, 2016-19
| Metric | Passing Only | All Plays |
|---|---|---|
| Passer Rating | 0.48 | 0.48 |
| ANY/A | 0.49 | 0.49 |
| IQR | 0.5 | 0.5 |
| EPA | 0.5 | 0.47 |
| Total QBR | 0.45 | 0.31 |
| Total Points Earned | 0.47 | 0.43 |
Almost all of the metrics fall into a narrow range of moderate predictiveness, with the overall Total QBR surprisingly lagging behind. To some extent, we might expect that given the number of additional factors that contribute to its calculation compared to the other metrics. That said, one would expect that isolating the value of the quarterback (e.g. with air yards and performance under pressure) would counterbalance those effects, but it doesn’t (in this sample at least).
On the other side of the coin, the simpler metrics achieve stability partially owing to their simplicity, but they won’t be as descriptive of a player’s performance or value, so they’re not as desirable to use week-to-week.
So Which Should I Use?
Based on their similarity in terms of overall results and predictiveness year-over-year, you could justifiably work with any of these stats when evaluating a passer, depending on your preferences.
If your goal is to understand how well a quarterback has performed in a way that allows you to know exactly what went into the evaluation, making for straightforward comparisons to what you see on the stat sheet, ANY/A might be the best choice because it accounts for sacks.
If you want a metric that relates well to the player’s on-field results and has modern analytical underpinnings behind it but is a bit more difficult to “see” on the field or in a box score, then IQR and EPA make sense as an option. EPA is a more all-encompassing stat, while IQR focuses on the quarterback’s throwing ability.
And if you are looking for metrics that use the wealth of data now available to us but at times will give results that look odd given what other statistics tell you, then QBR and Total Points Earned should be your choice. You might have to spend extra time digging into the contextual factors that make those results different, but you can feel confident that much more is being taken into account than with the above options.
Who are the Best Quarterbacks in 2019 So Far?
Perhaps with all of these metrics available, the best way to use them is to aggregate them. As a quick exercise, we can take each metric, scale it so that each one’s average is 0 and standard deviation is 1, weight them by the number of “Yes” boxes in the reference table above (to give more weight to more robust stats) and then sum up the resulting values for each. Here are the overall leaders for 2019 using that method.
Top Ten Quarterbacks of 2019, Ranked by Weighted Aggregation of Six Metrics
| Rank | Player | Passer Rtg | IQR | ANY/A | EPA* | QBR | Total Pts Earned* |
|---|---|---|---|---|---|---|---|
| 1 | Patrick Mahomes | 111.9 | 120.2 | 9.5 | 25.9 | 76.6 | 25.8 |
| 2 | Russell Wilson | 124.7 | 132.3 | 9.2 | 19.3 | 79.4 | 21.6 |
| 3 | Dak Prescott | 102.9 | 104.2 | 8.2 | 24.4 | 81.1 | 25.5 |
| 4 | Deshaun Watson | 107.9 | 113.4 | 7.5 | 25.7 | 75.9 | 18.2 |
| 5 | Matt Ryan | 102.7 | 115.3 | 7 | 18.6 | 62.9 | 23.8 |
| 6 | Lamar Jackson | 96.7 | 106.9 | 6.7 | 15.9 | 64 | 13.3 |
| 7 | Kirk Cousins | 108.4 | 115 | 7.9 | 9.7 | 49.8 | 14.3 |
| 8 | Tom Brady | 97.5 | 109.5 | 7.3 | 10.8 | 57.1 | 14.1 |
| 9 | Carson Wentz | 94.3 | 100.2 | 6.7 | 4.8 | 67.8 | 14.1 |
| 10 | Matthew Stafford | 99.1 | 100.1 | 7.7 | 13.7 | 58.8 | 11 |
* Average Per 100 Plays