Recently, we at Sports Info Solutions (SIS) released the 2018 reactive playcalling tendencies for all 32 NFL teams. The basic concept was detailed by Bill Walsh in his coaching manifesto Finding the Winning Edge:
“Defensive coaches base much of their game plans on the offensive tendencies of their opponents,” he wrote. “Such tendencies typically evolve from the offense's reaction to such fundamental factors as down, distance, field position, personnel, situational circumstances, and contingency plans…Collectively, these special plays are commonly referred to as a team's ‘reactive offense.’”
Walsh asserted the conventional reactive situations were:
- A first down call after getting a first down rushing.
- A first down call after getting a first down passing.
- A first down call after the completion of an explosive pass.
- A first down call after an explosive run.
- A first down call after a positive penalty (i.e., 1st and 5).
- A second down call after a sack.
- The next first down call to start a series after your team has lost the ball on a fumble or interception.
- A first down call to start a series after your opponent's loss of possession due to a turnover.
In this article, we won’t be examining penalty situations. Instead, we’ll replace them with an idea set forth by Warren Sharp: a team’s tendency to throw the ball after an incompletion on 1st & 10. We’ll also examine what teams do on possession-and-10 (i.e. the first play of a drive).
Coincidentally, we were first introduced to the notion of reactive playcalling by Warren Sharp and Zach Dunn, so it’s fitting that we are coming full circle and releasing the 2018 reactive playcalling tendencies for the top 25 college football teams here. Since the AP and Coaches polls aren’t out, we’ll be using the rankings recently published by NCAA.com, which is to say that if you don’t see your favorite team here, it’s not because we have a bone to pick with them.
With that out of the way, here is how the data is calculated and presented:
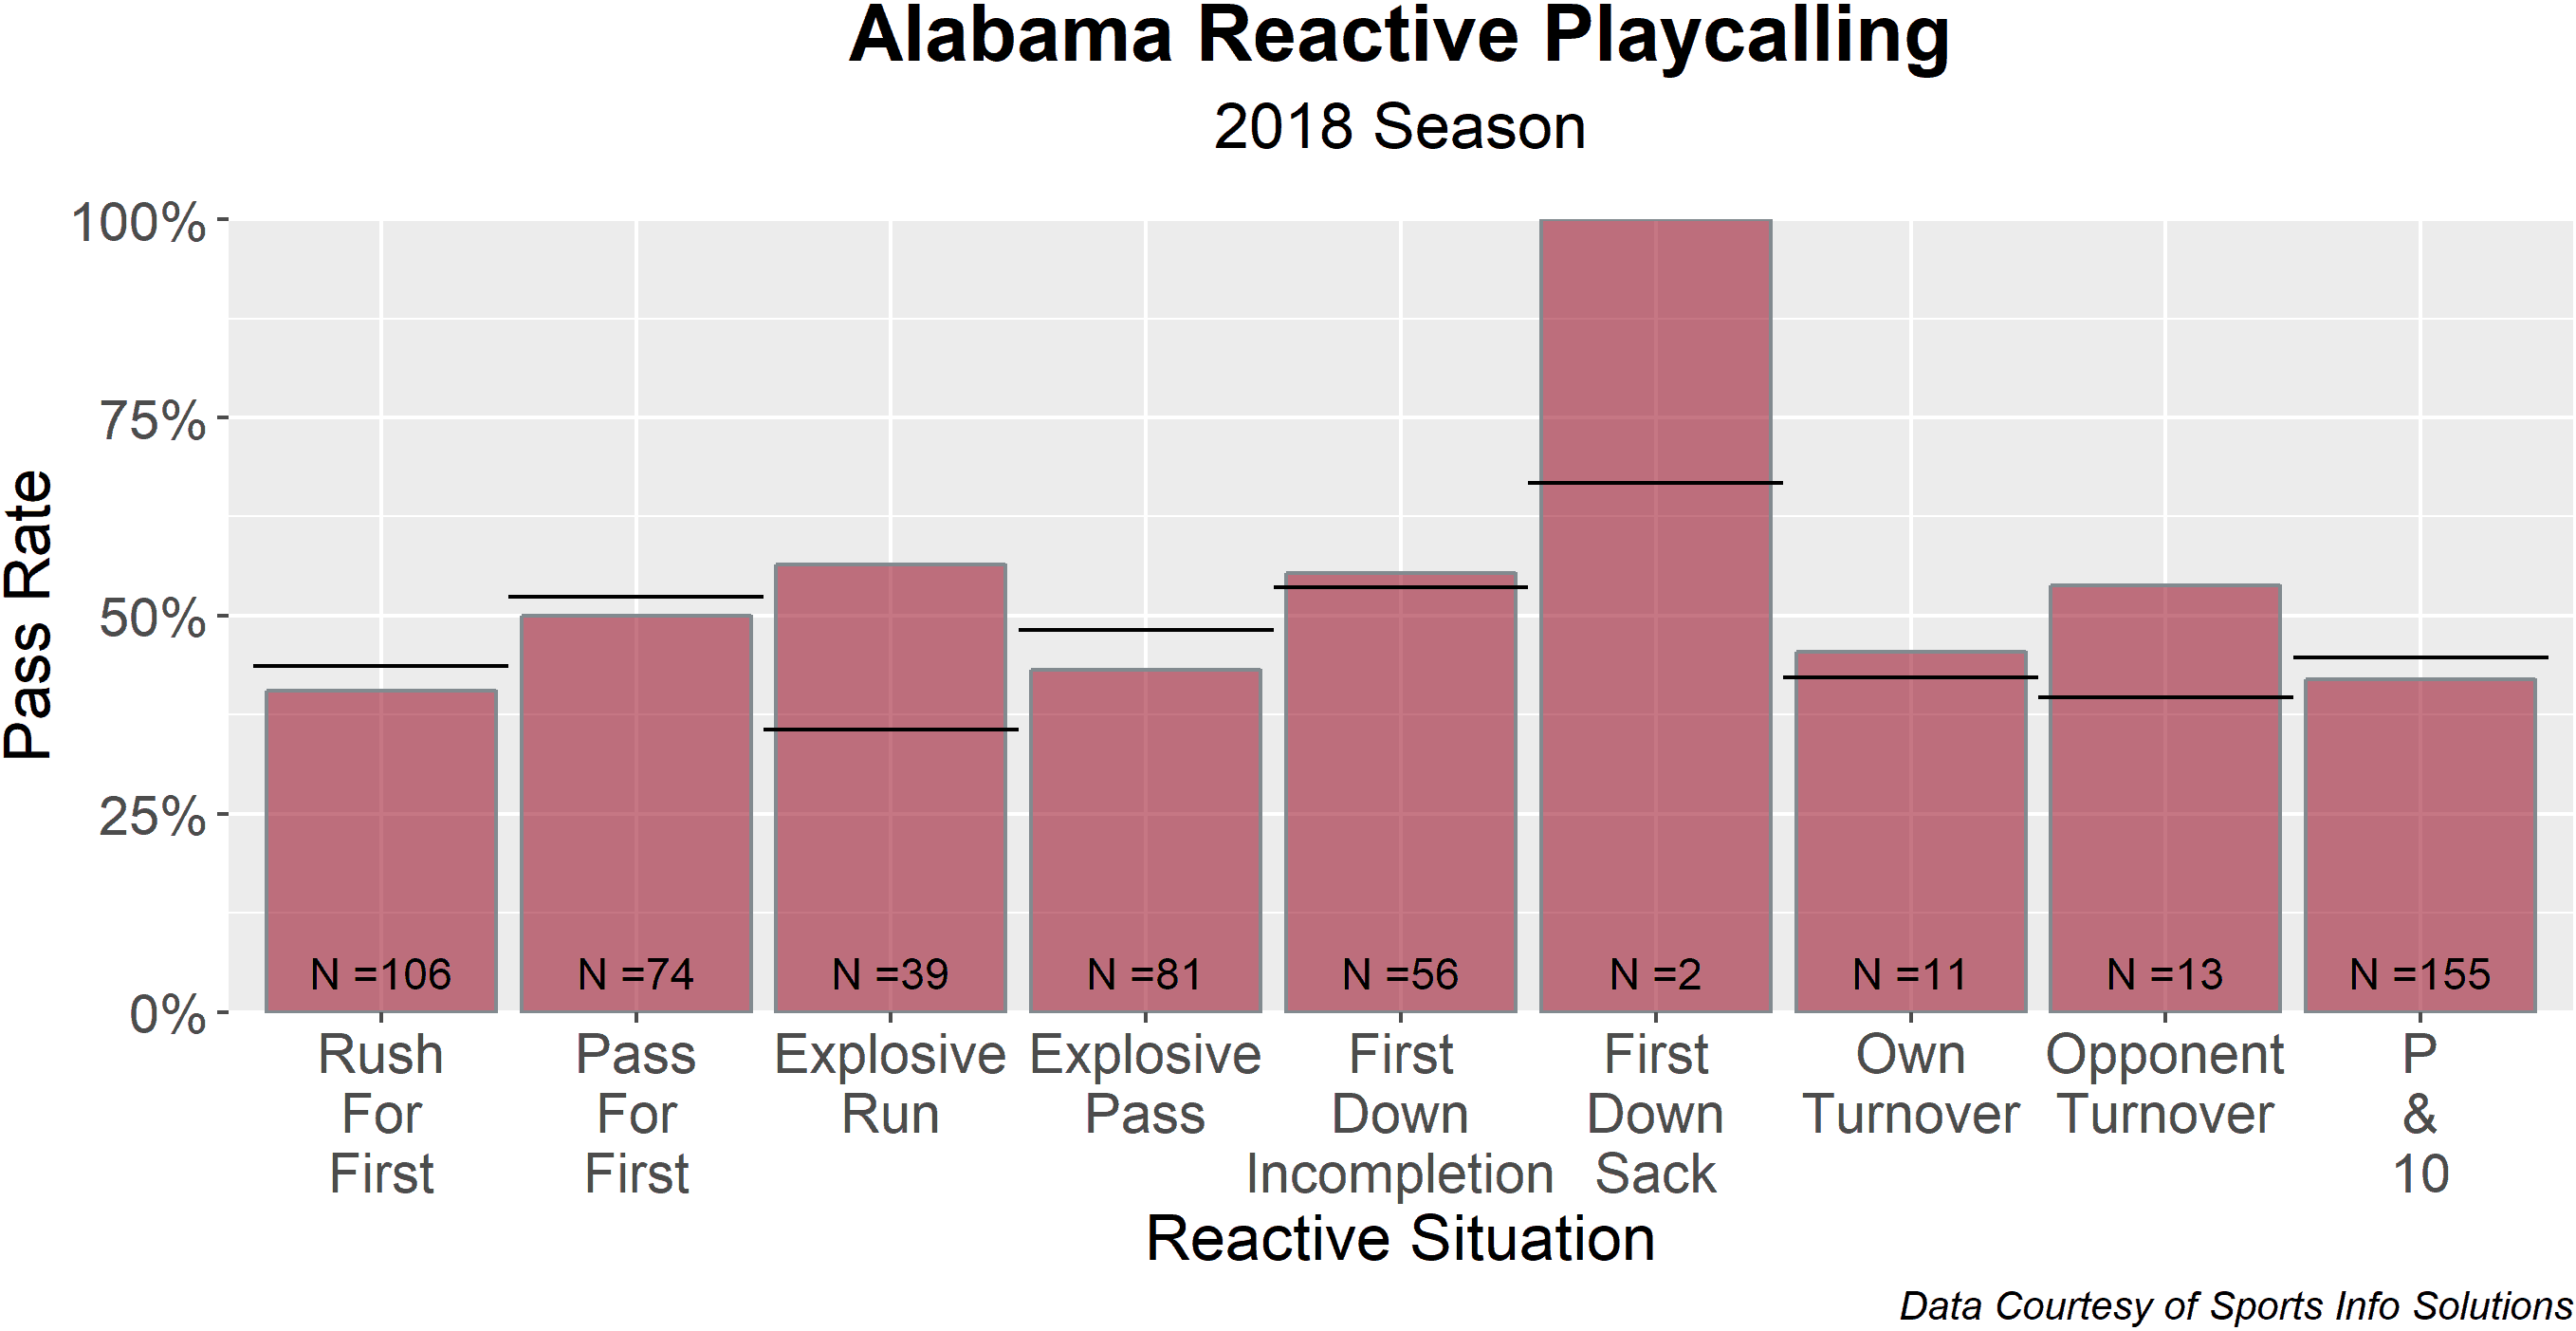
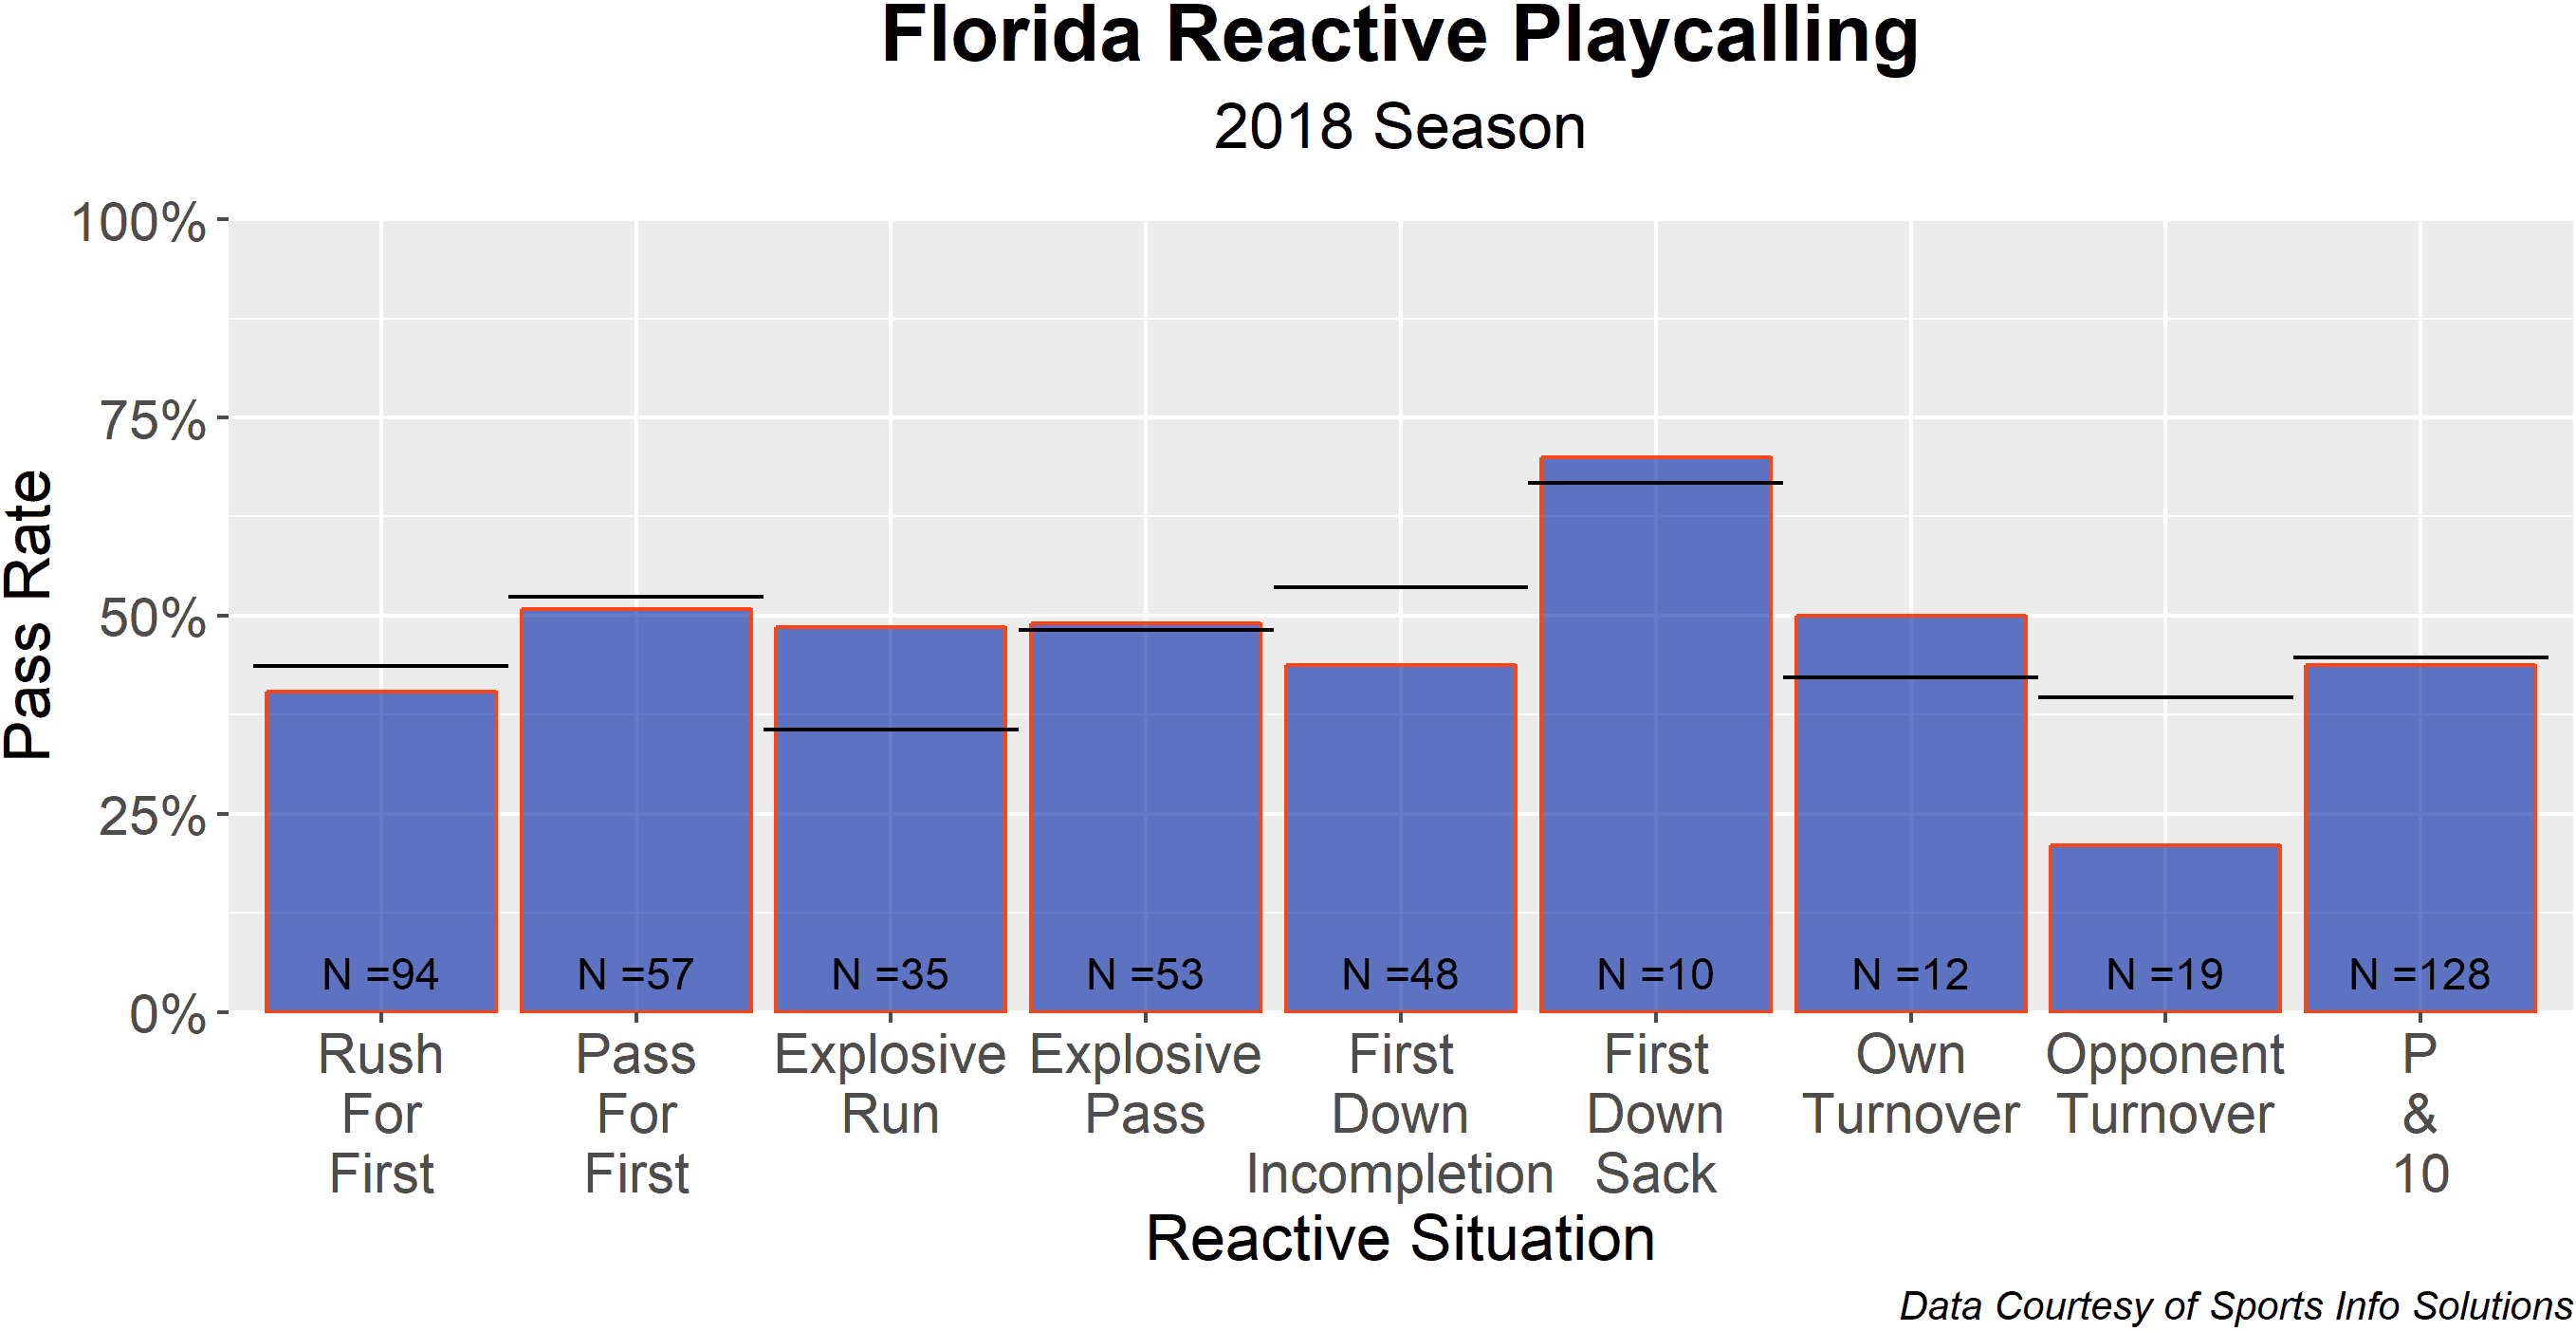
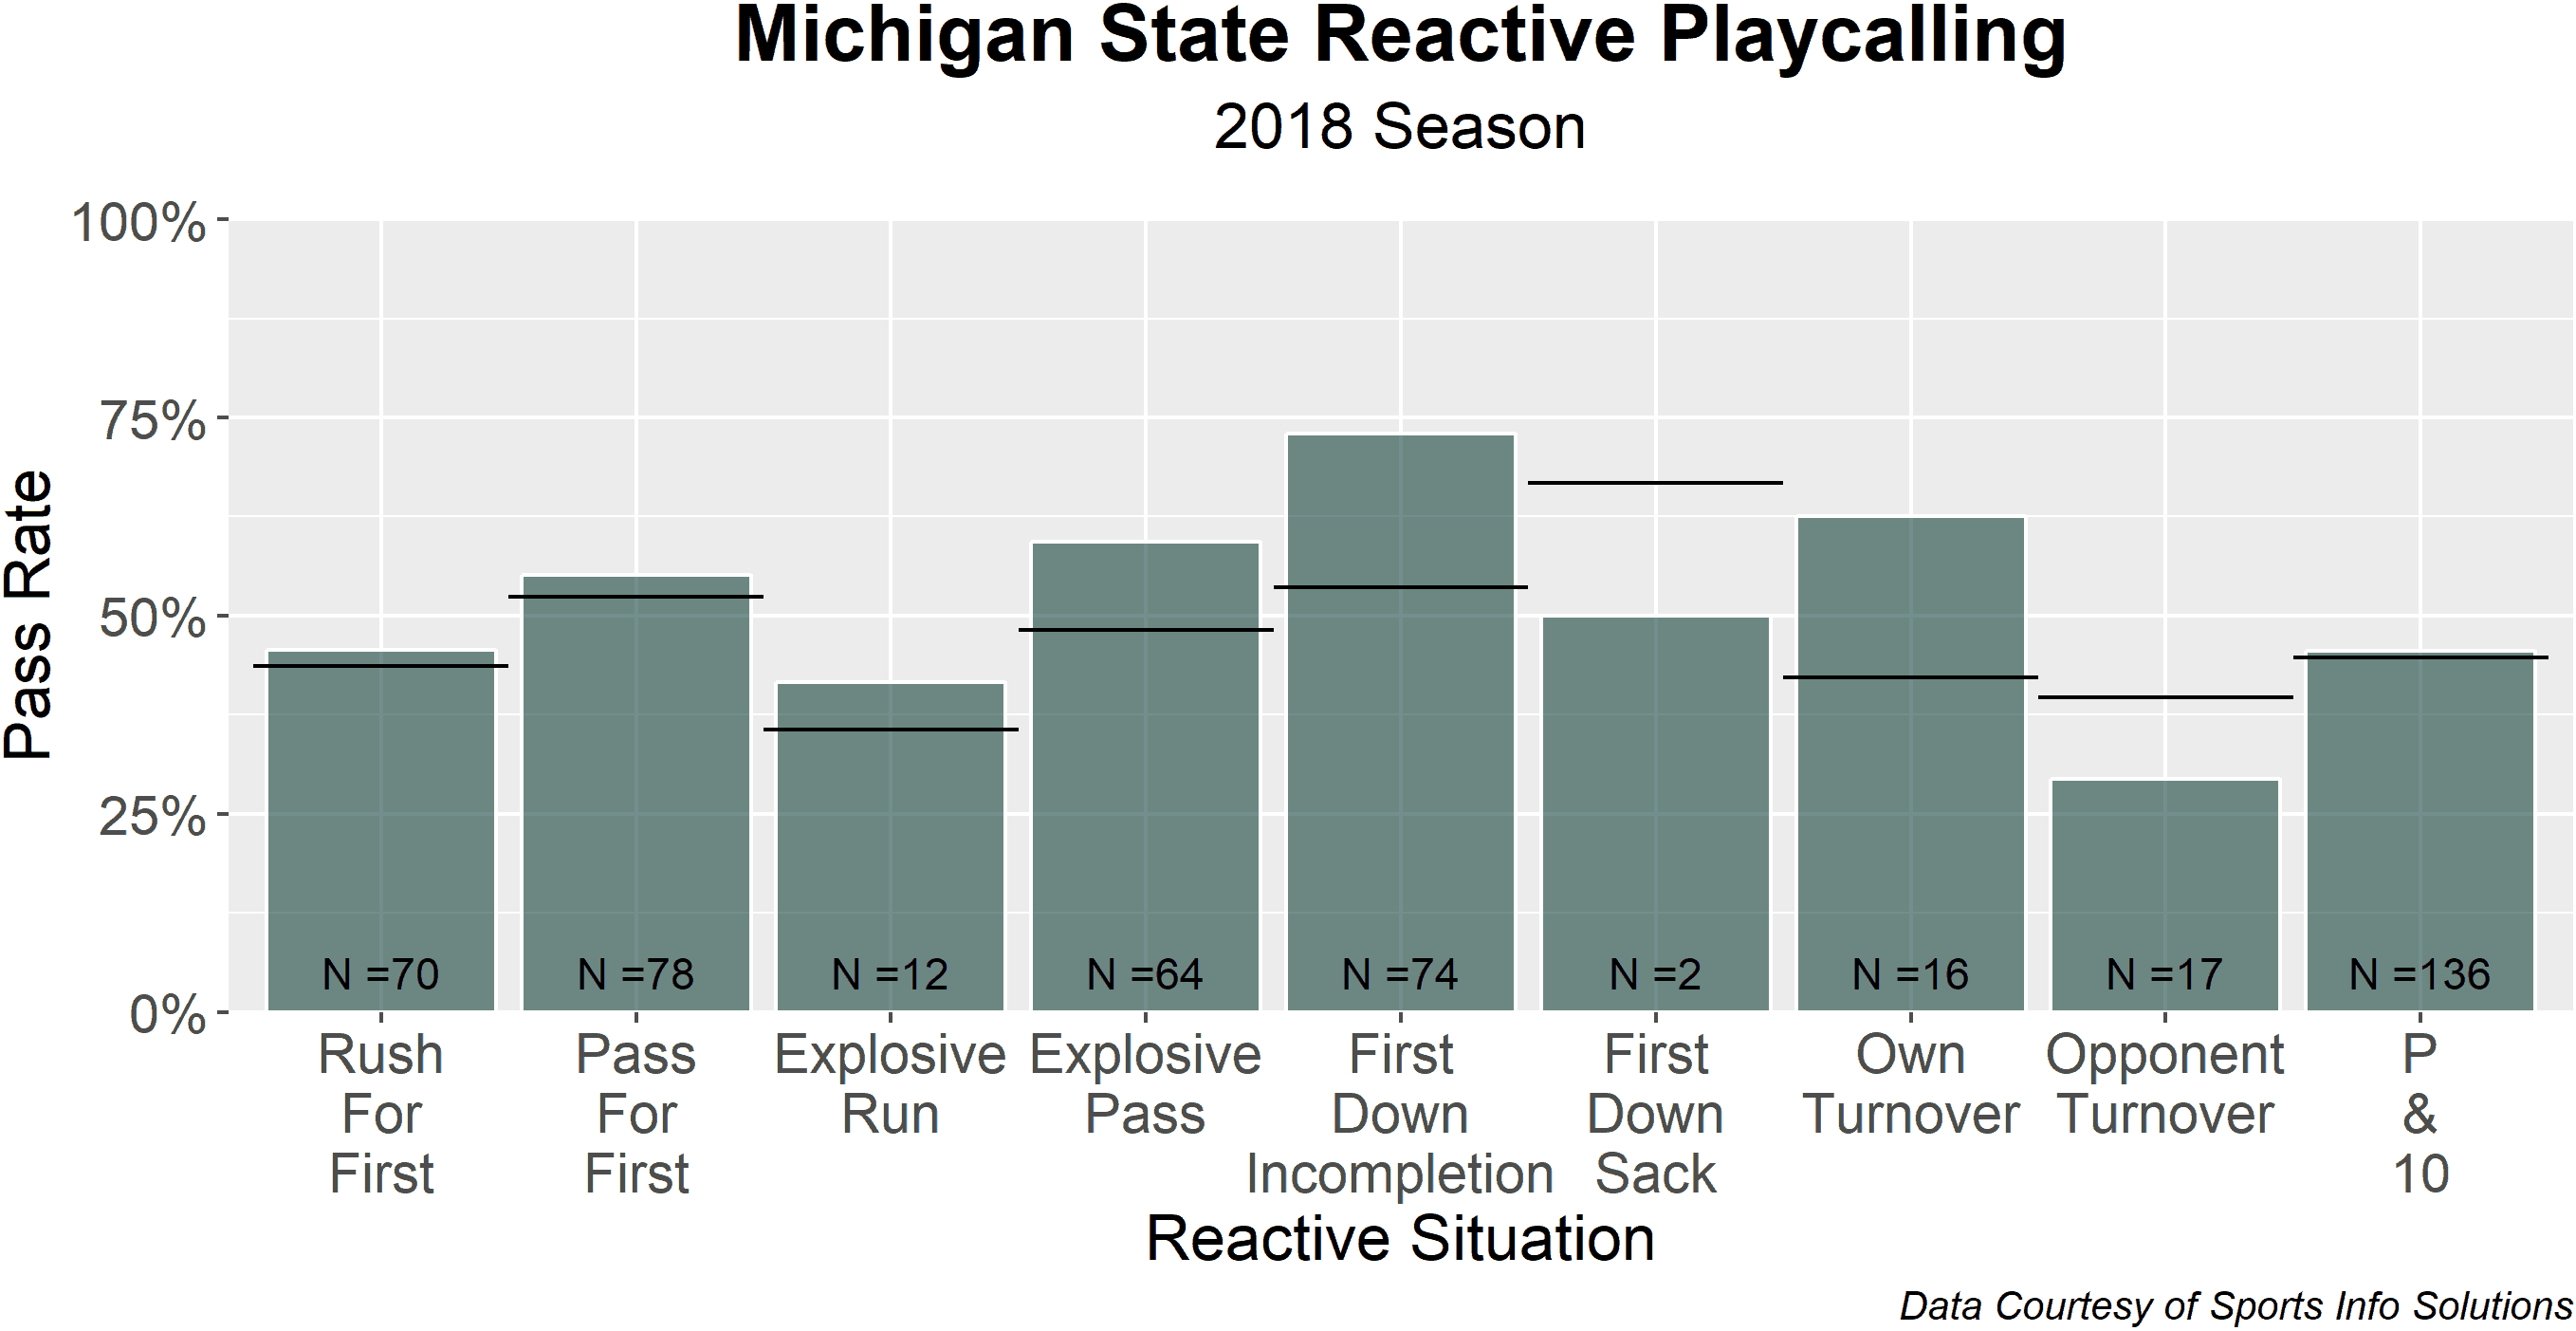
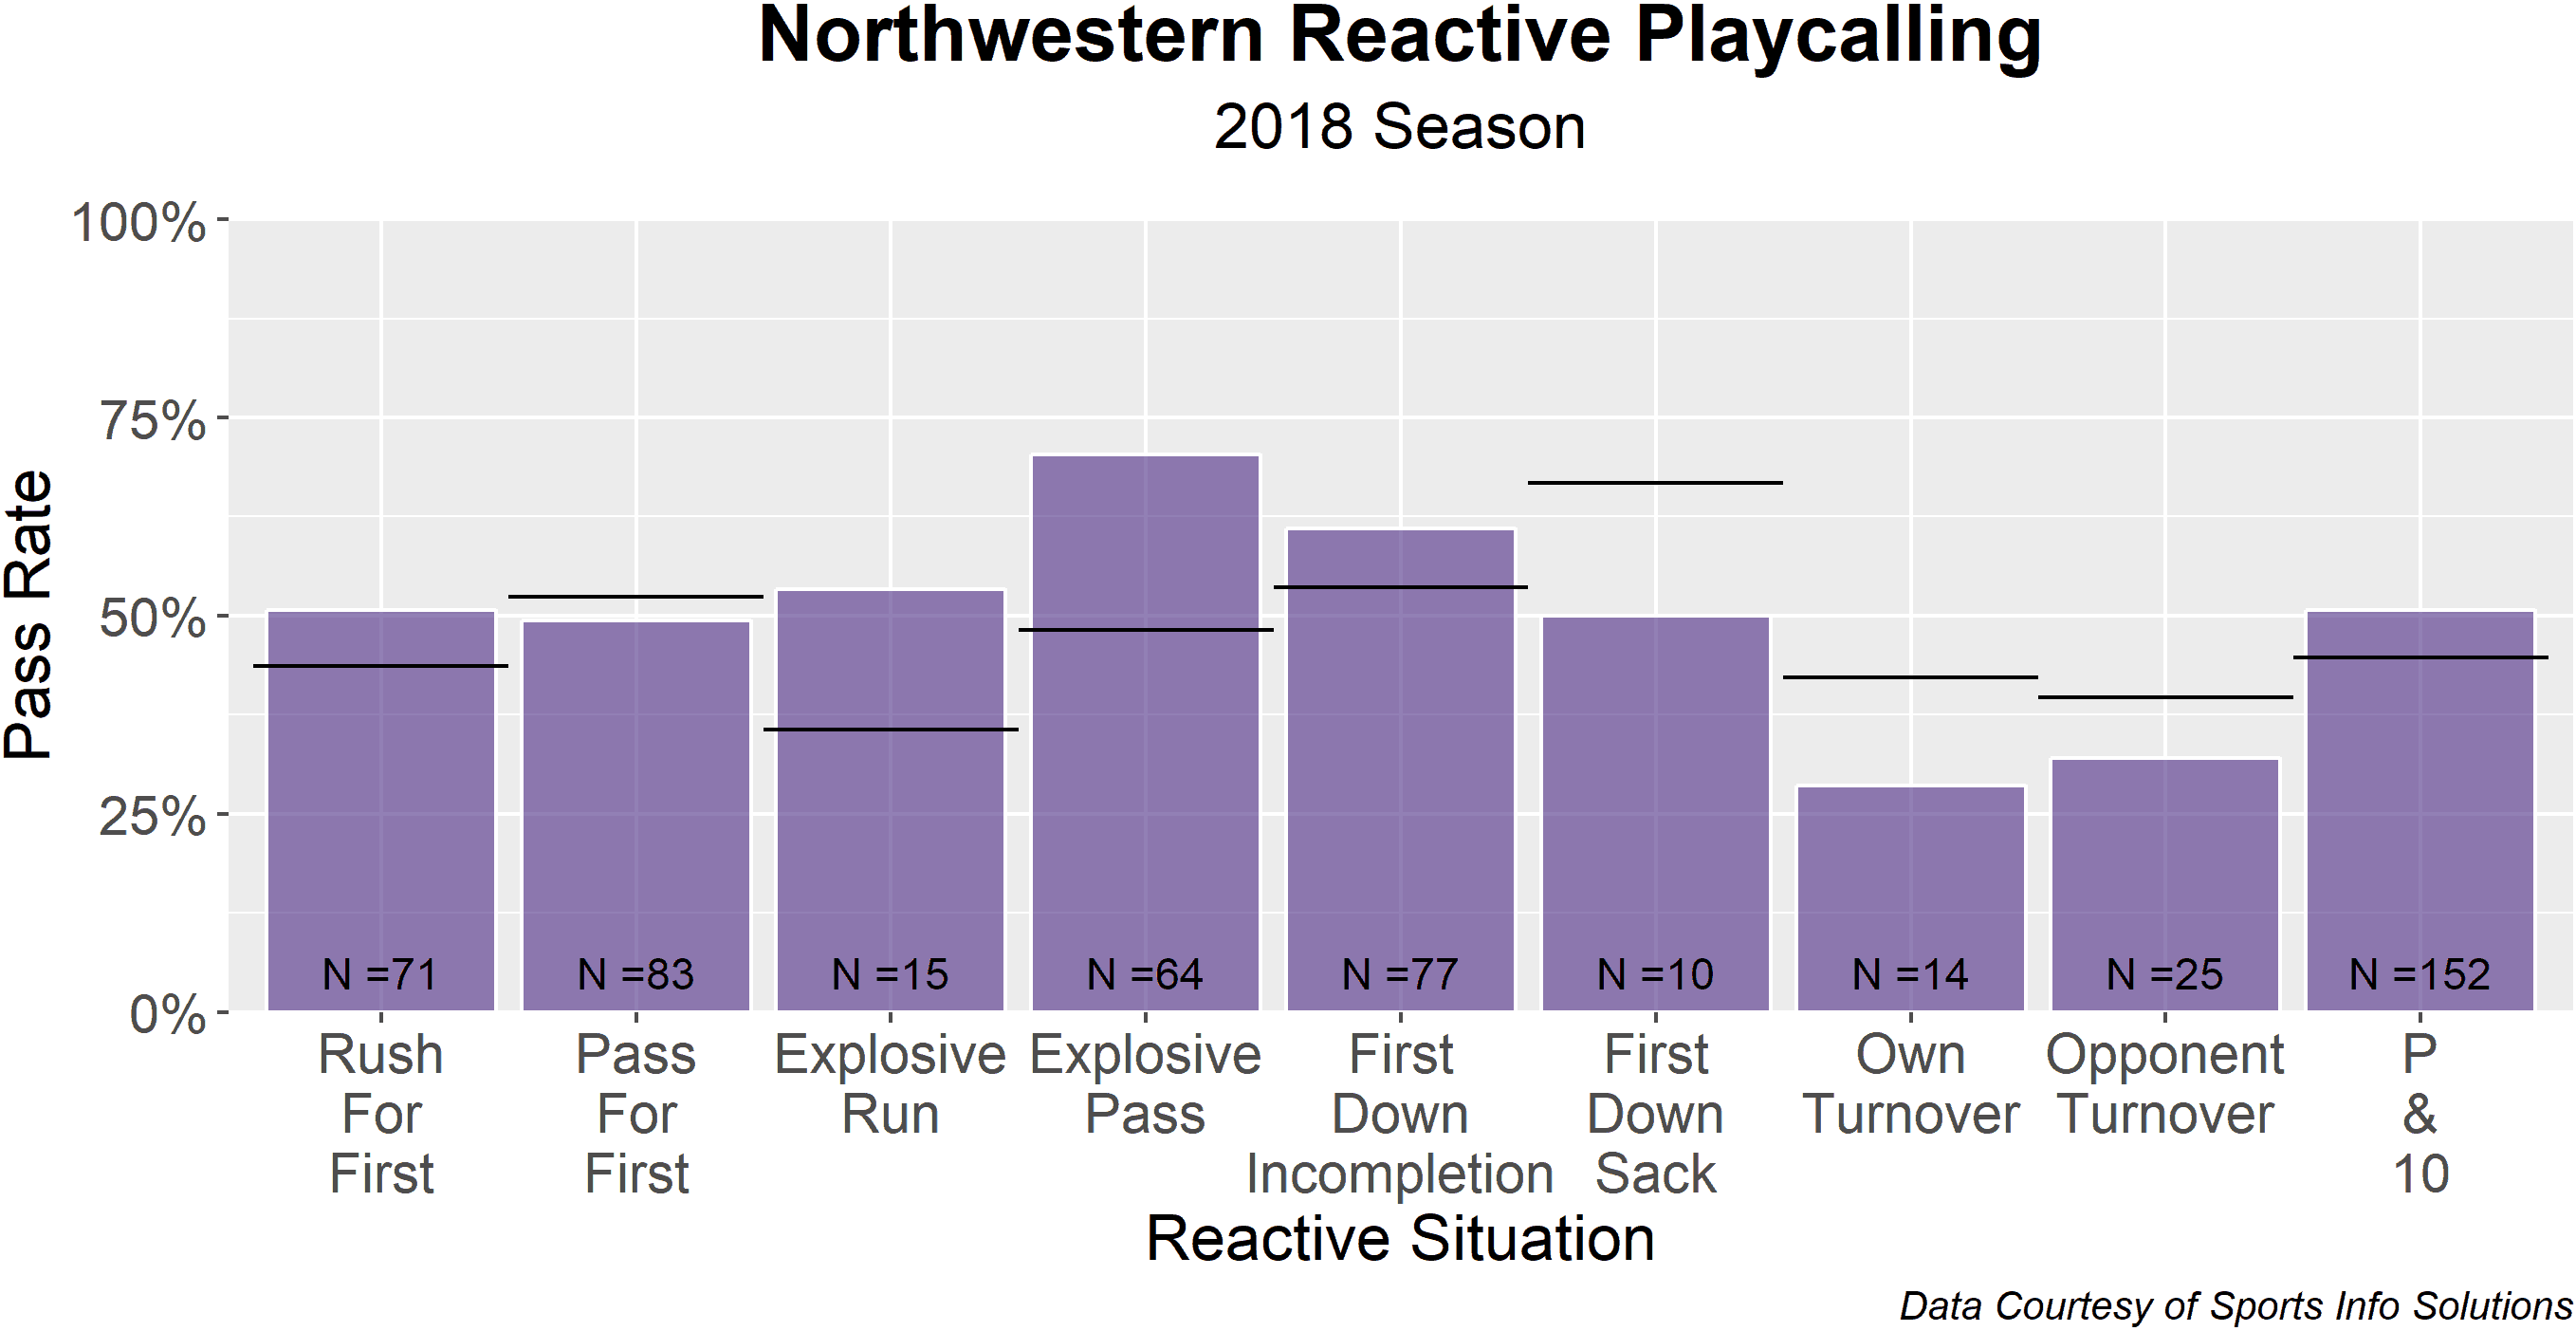
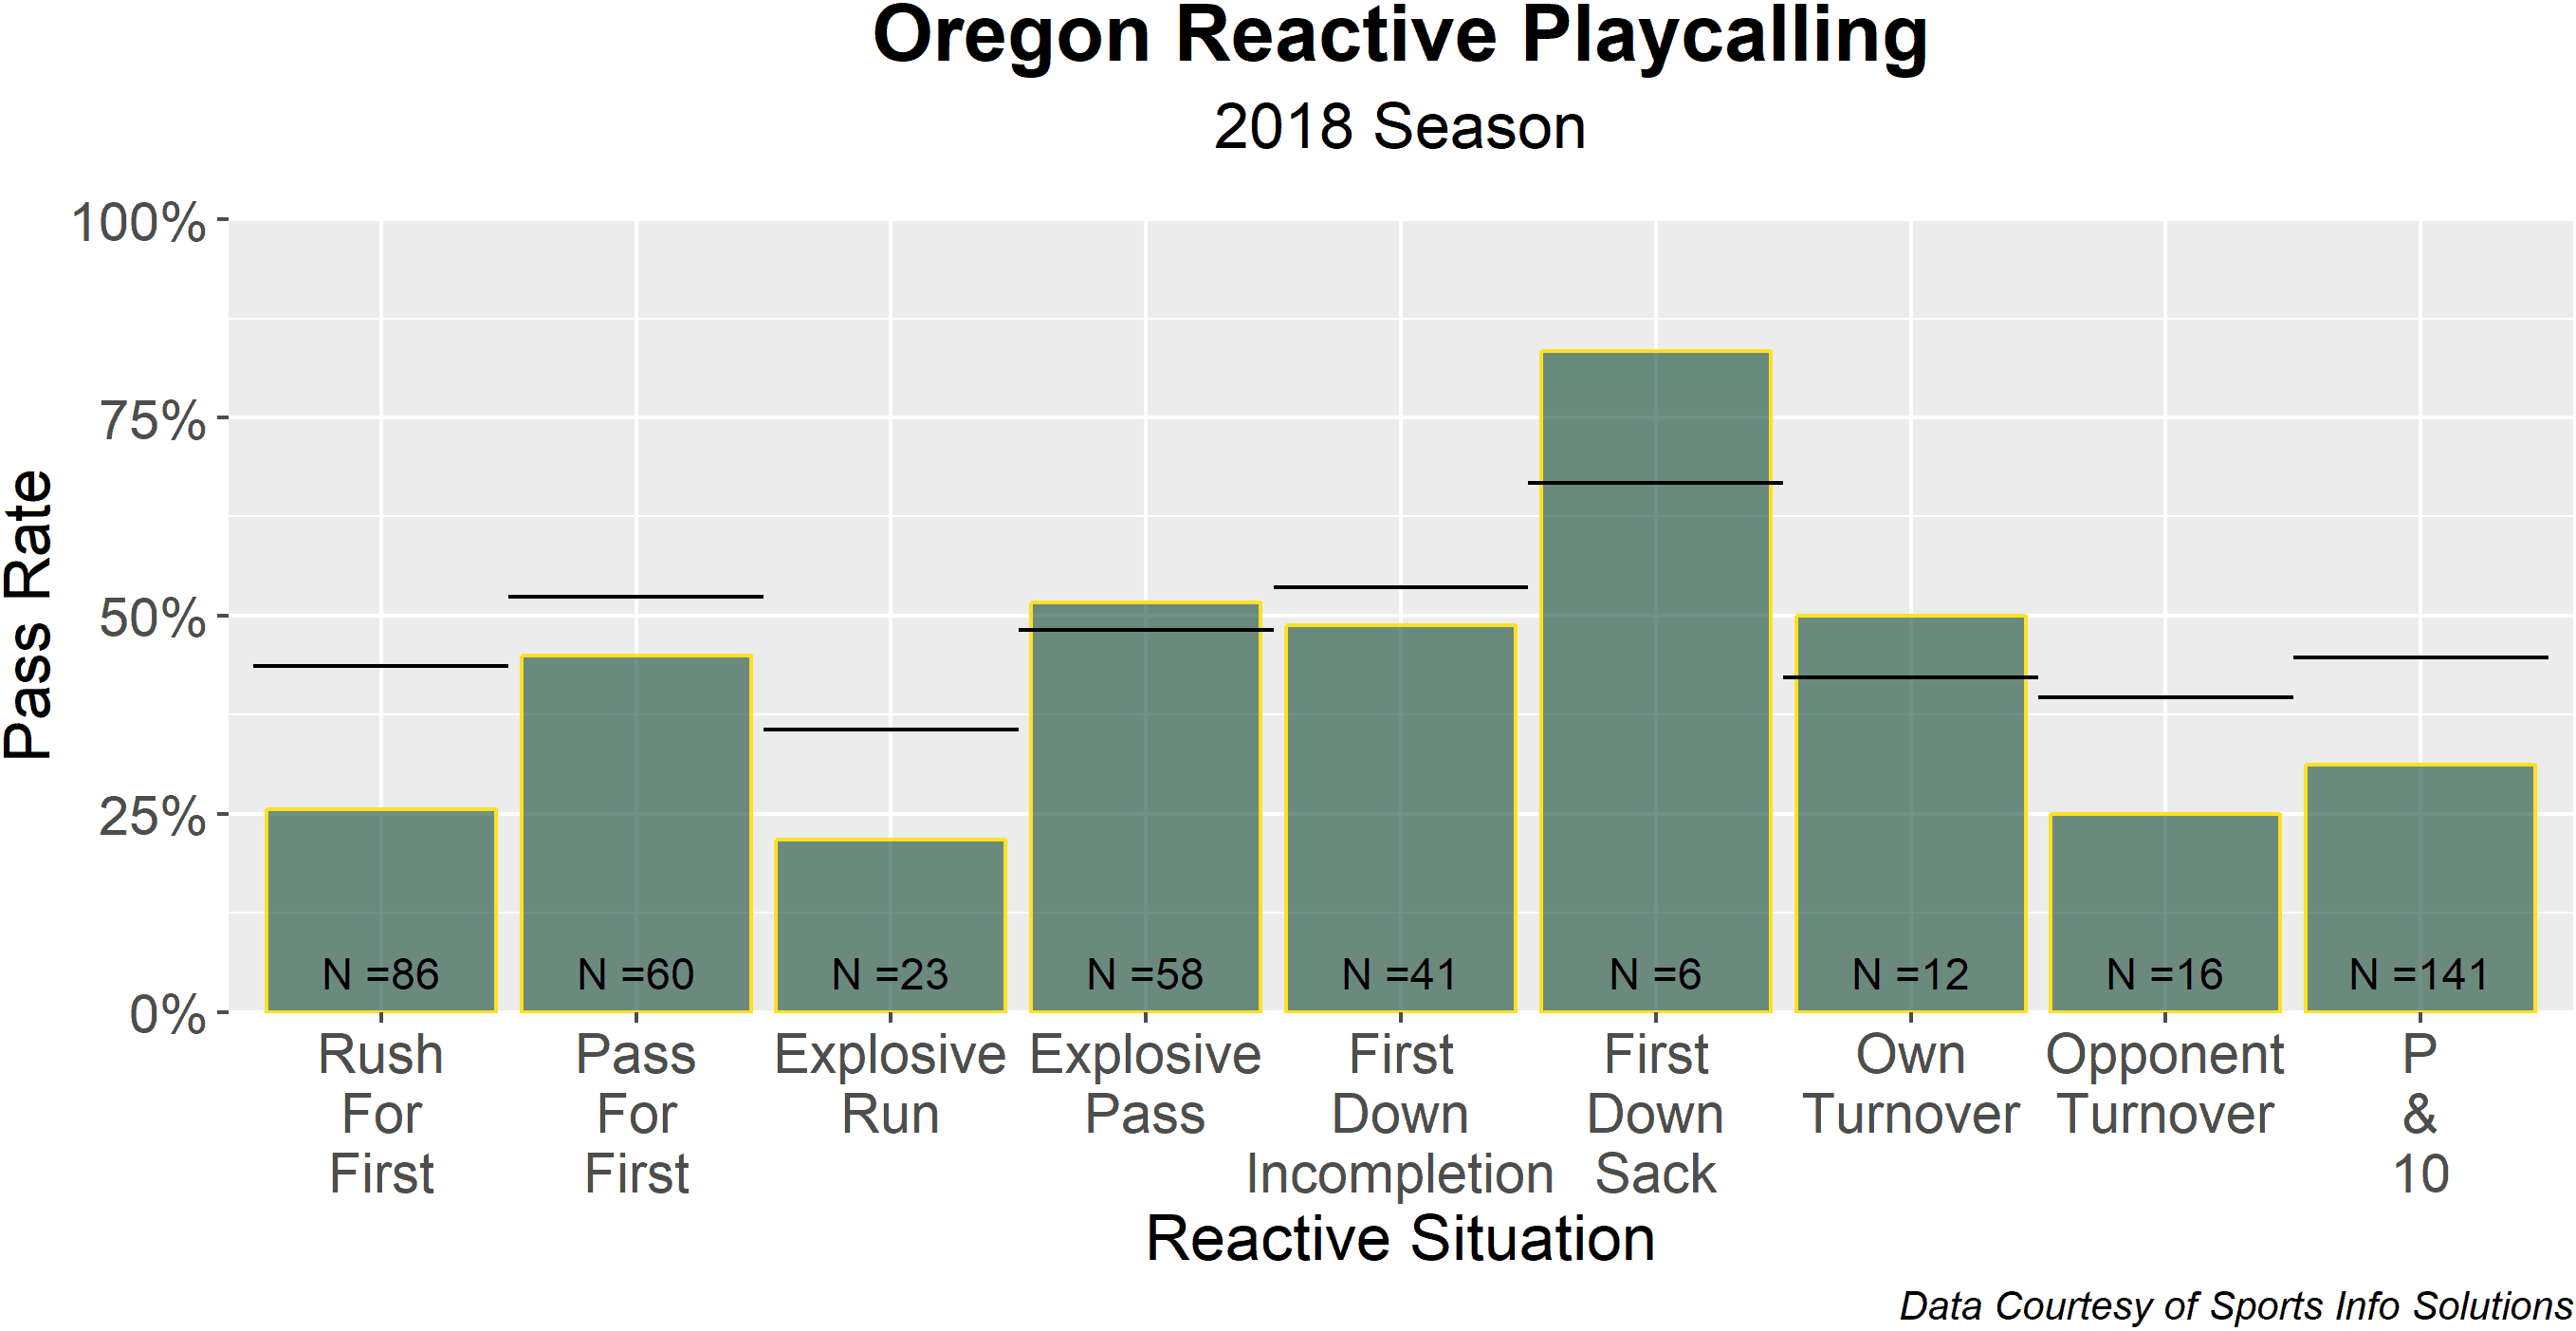
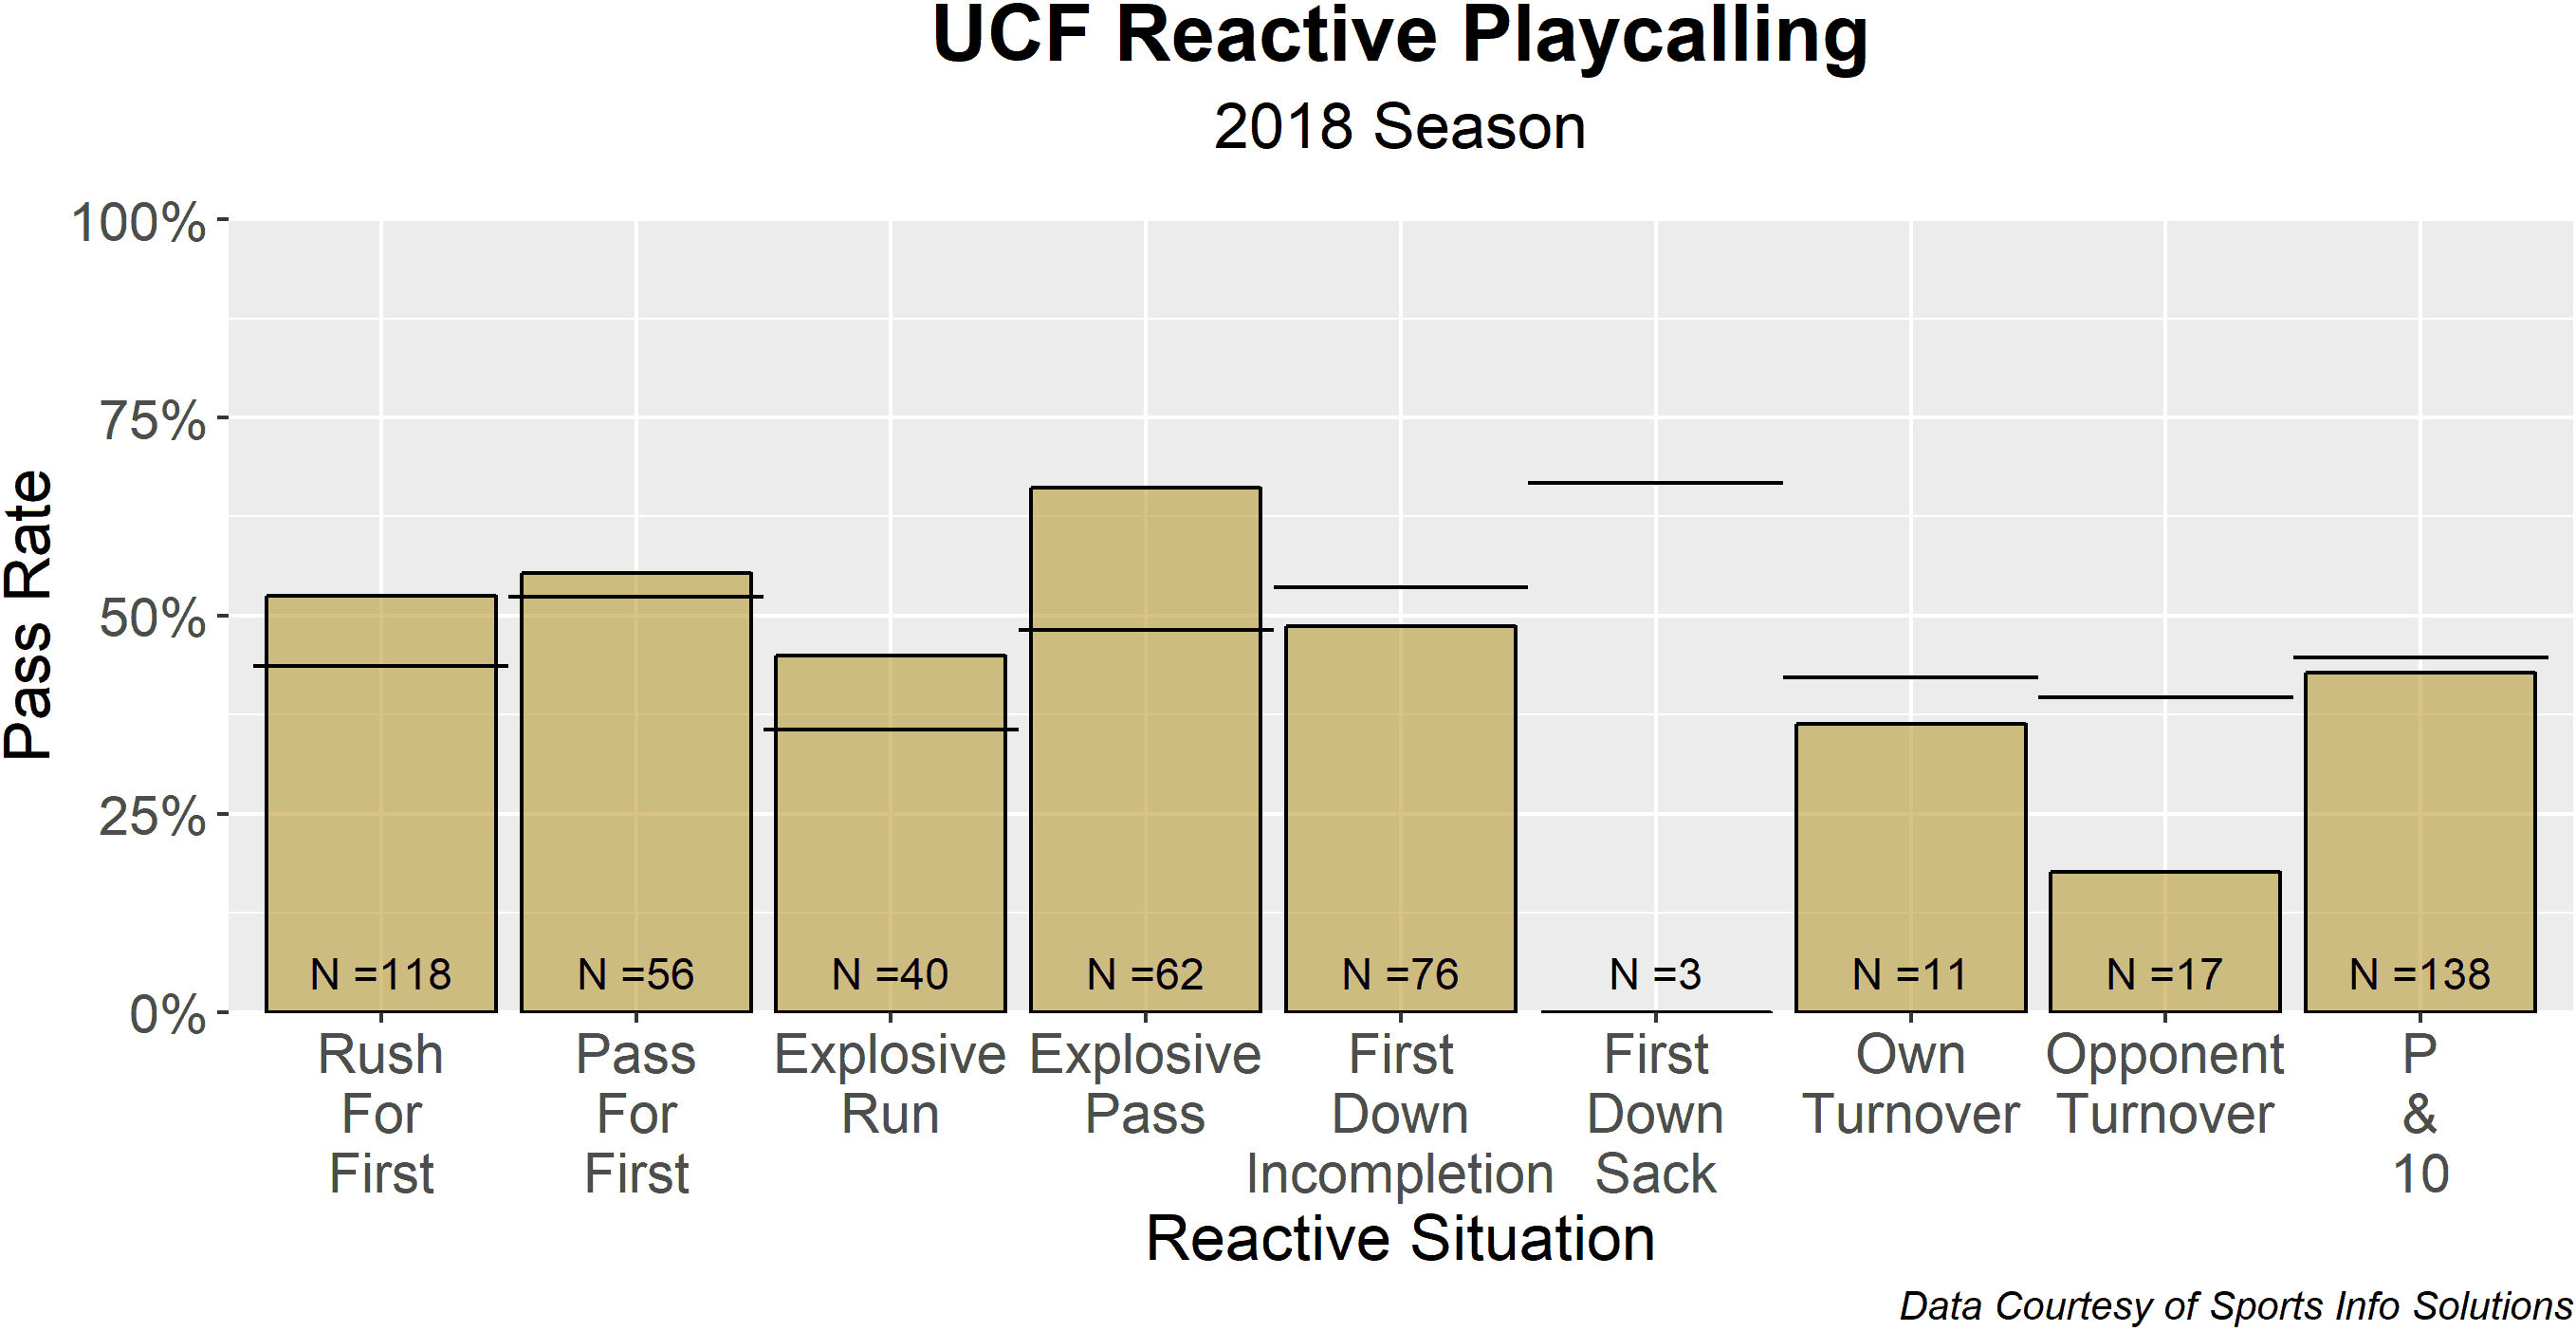
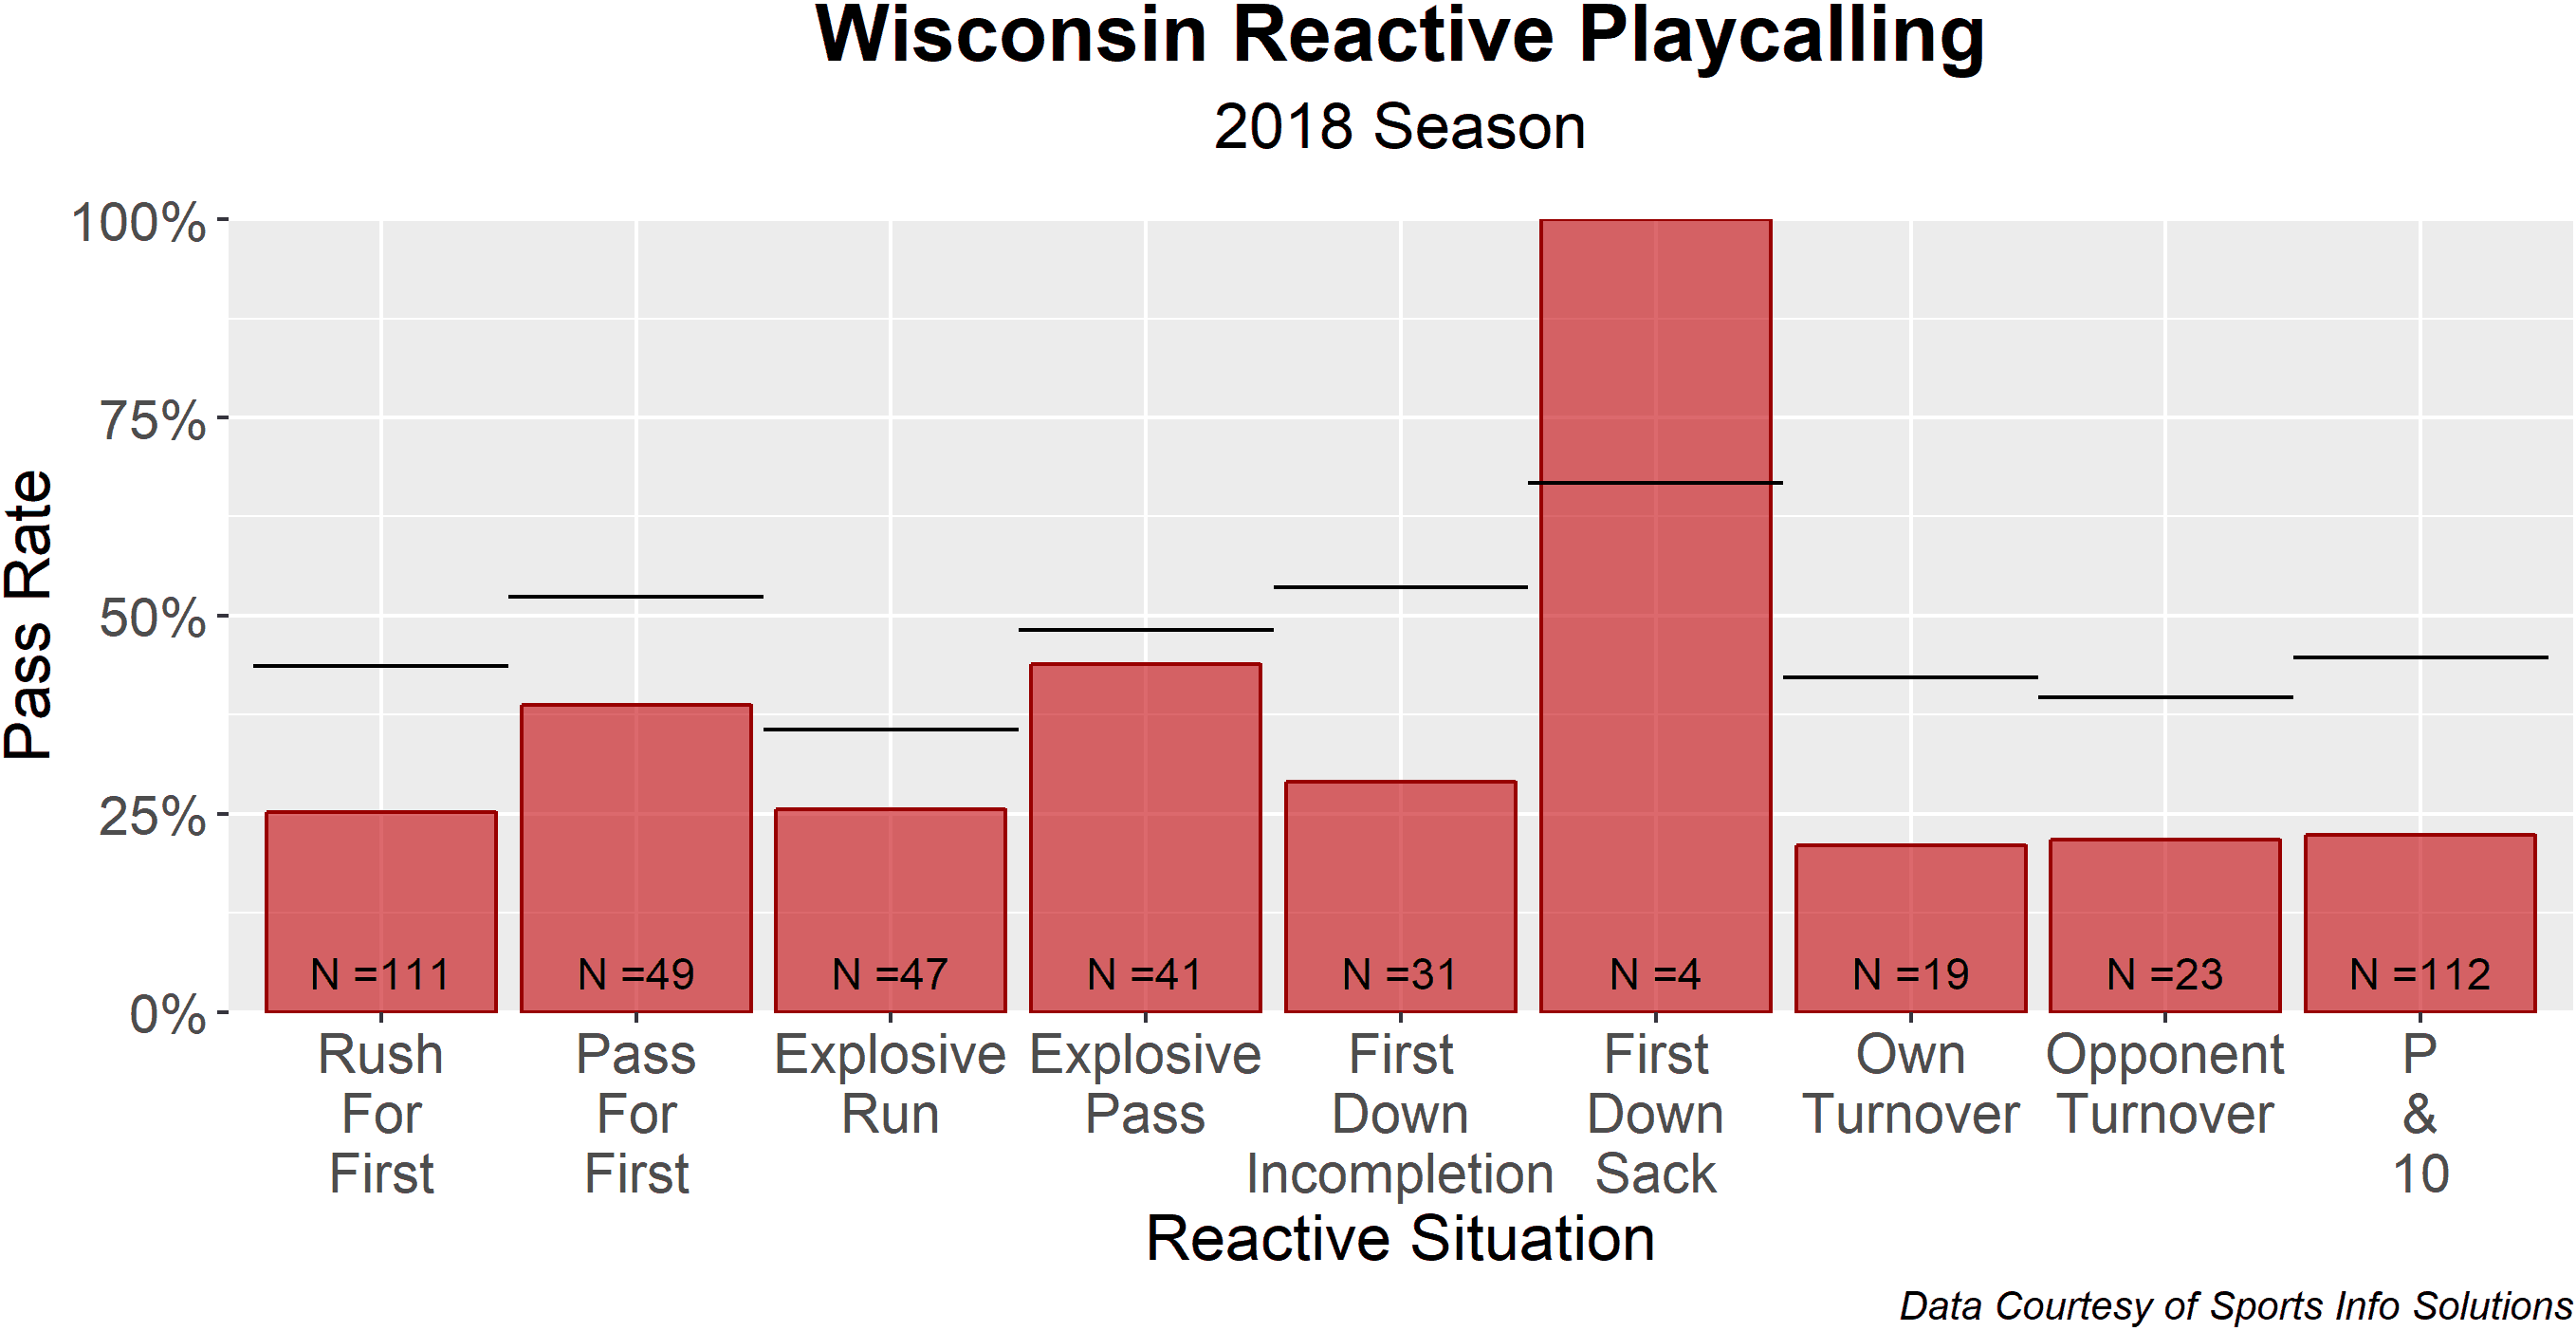
The charts represent how often a team passes relative to league average following a certain result.
The black lines represent the league average rate for each reactive situation. “N =” indicates the number of times a team found itself in the specified reactive situation. Quarterback kneels were removed from the sample, so a team that kneeled the ball after hitting an explosive run to seal the game won’t have its pass rate watered down by such plays.
It should also be noted that explosive (15+ yards) passes and runs weren’t double-counted in passes and runs for firsts respectively, just as turnover-related opening plays are excluded from the P & 10 (possession-and-10) sample. Lastly, pass rate is based on the intent of the play, so scrambles and backward passes are considered passes for the purpose of these calculations.
For example, you’ll notice Alabama didn’t deviate too far from the collective average in most situations but was notably more aggressive through the air following an explosive run. Without further ado, please enjoy and watch your step for small samples!