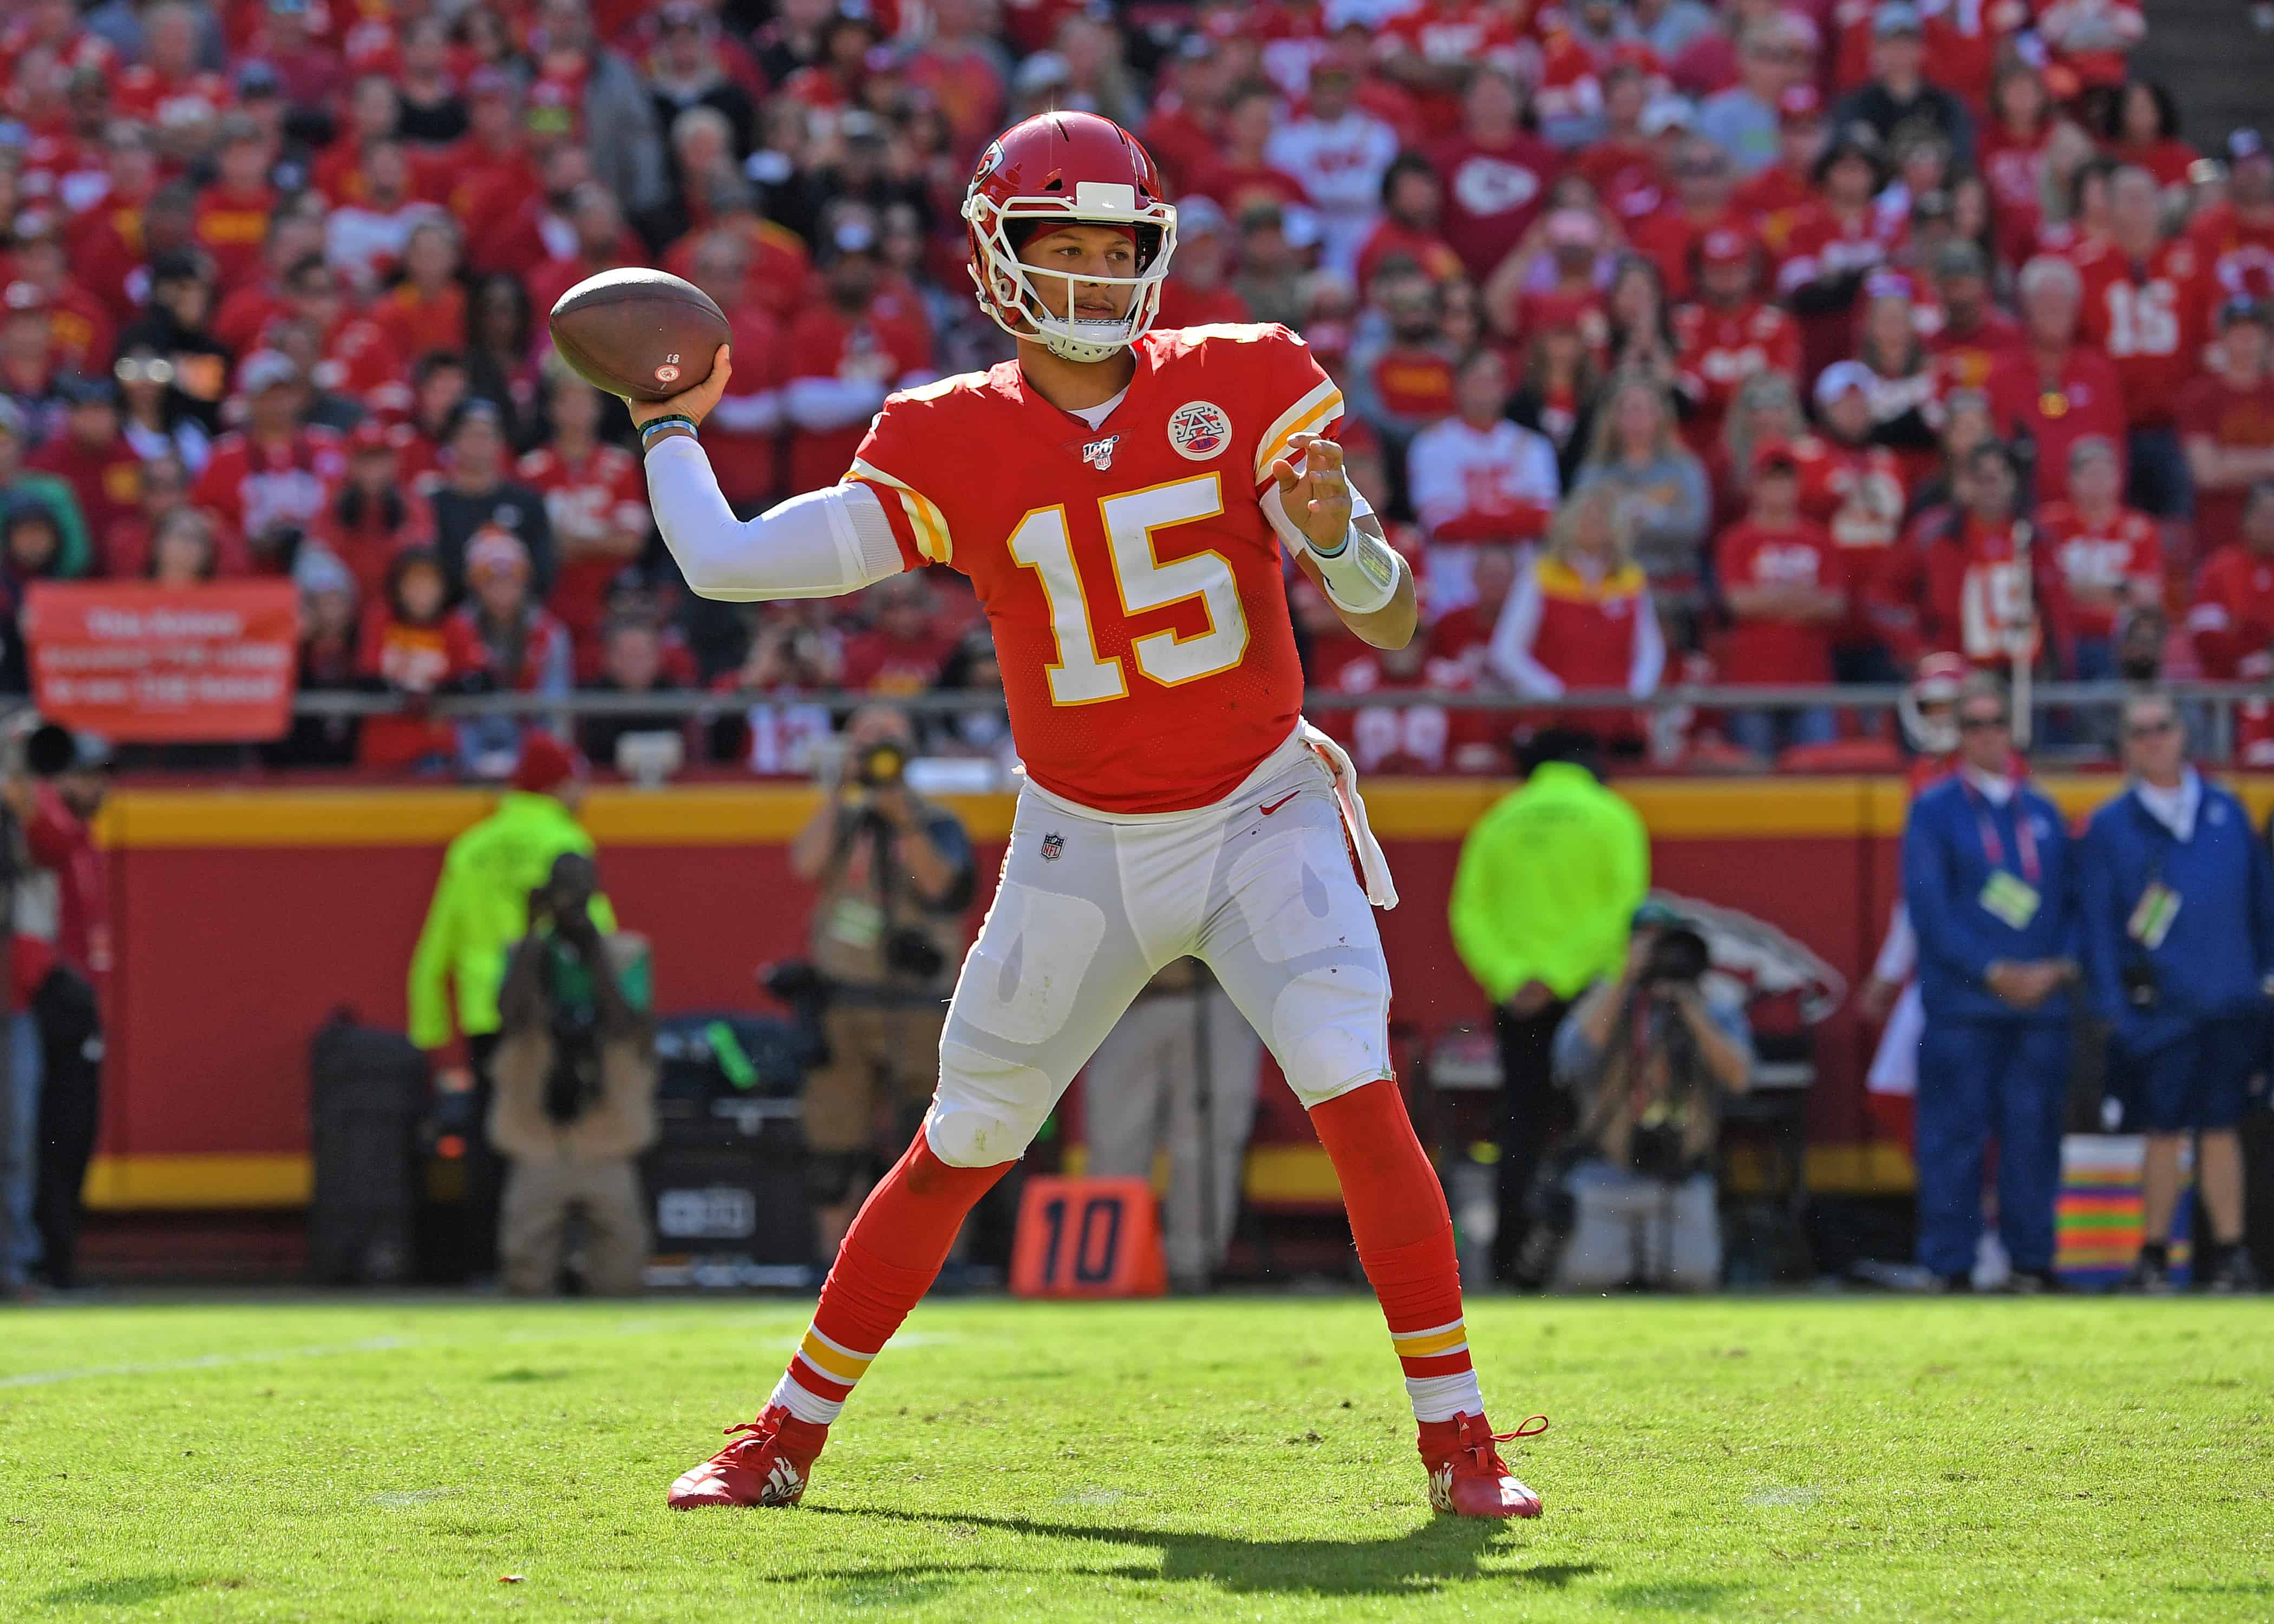
It’s arguable that Patrick Mahomes has had the best start to a career than any other quarterback in league history. Through 35 NFL starts, Mahomes ranks first all-time in passing touchdowns (87) , adjusted passing yards per attempt (9.3 AY/A) and passing yardage (10,600 yards) while second in yards per pass attempt (8.5) only behind Kurt Warner (8.9 Y/A).
Adjusting for era played, the only other quarterbacks to have a higher passer rating index (how a quarterback performed compared to league average) than Mahomes through 35 career starts are Warner and Dan Marino.
Mahomes didn’t quite have as gaudy of a 2019 campaign as he did in 2018, but even with a bit of regression and playing through some injuries, Mahomes managed to finish fourth in the league in yards per pass attempt (8.3), seventh in passing yardage per game (287.9), and eighth in touchdown rate (5.4%) during the regular season. Prior to the postseason, Mahomes had two or fewer touchdown passes in his final six regular season games. But in the playoffs, he’s kicked it up a notch and has played as well as he did to open the season.
In the Divisional Round, Mahomes completed 23-of-35 passes (65.7%) for 321 yards and five touchdowns (134.6 rating) and then followed that up by completing 23-of-35 passes (65.7%) for 294 yards and three touchdowns (120.4 rating) to win the AFC. It was the first time Mahomes had back-to-back games with a rating of 120 since the opening three weeks of the season. On top of all that passing, Mahomes also has run for 53 yards in each playoff game this year with a rushing score.
Mahomes vs Top Pass Defenses in Pressure and Expected Points
The 49ers have boasted one of the better pass defenses in the NFL this season, ranking near the top of the league in multiple categories. During the regular season, San Francisco ranked second in the league in expected points added via their pass defense (66.2), second in pressure rate (28.7%) and sack rate (8.5%) and first yards per pass attempt allowed (5.9) and first in yards per completion (9.7).
On the pressure front, Mahomes has been pressured on just 29.1% of his dropbacks this season, which is the fourth-lowest rate out of the 28 quarterbacks this season that took at least 50% of their team dropbacks this season per Pro Football Focus. When Mahomes was pressured, he handled it well, taking a sack on just 10.7% of those pressures (second lowest rate) while ranking fourth in accuracy and second in quarterback rating on those pressured dropbacks.
In terms of facing elite defenses on the pressure front, Mahomes and the Chiefs had just five games this season (including the postseason) against teams in the top-12 of the league in pressure rate. In the playoffs, they’ve faced the 25th ranked Titans and 31st ranked Texans in pressure rate. Despite handling pressure at high levels from a league perspective, Mahomes’s raw totals still took a step back in those games versus his other games.
| Mahomes vs D | G | Comp% | Y/A | PaYd/Gm | TD | INT | RuYd/Gm | FF Pts |
|---|---|---|---|---|---|---|---|---|
| Top-12 Pressure | 5 | 66.90% | 7.8 | 253.6 | 8 | 3 | 20.4 | 18.6 |
| Non | 10 | 64.70% | 8.7 | 330.2 | 25 | 2 | 22 | 26 |
*Week 7, when Mahomes left in the first half, was excluded
From an expected points front, the Chiefs faced just four pass defenses with Mahomes under center that ranked in the top-12 in passing EPA via pass defense in the Patriots (first), Ravens (fifth), Bears (11th), and Broncos (12th). In the postseason, Kansas City has faced the 21st and 28th ranked pass defenses in EPA. The Chiefs caught Baltimore early in the season when their defense was a far cry from the unit they closed the season with, but here are the game logs for Mahomes in that small sample of opponents.
| Mahomes vs D | G | Comp% | Y/A | PaYd/Gm | TD | INT | RuYd/Gm | FF Pts |
|---|---|---|---|---|---|---|---|---|
| Top-12 Pass EPA | 4 | 71.50% | 8.7 | 312 | 8 | 2 | 10 | 22.5 |
| Non | 11 | 63.30% | 8.3 | 302 | 25 | 3 | 25.6 | 23.9 |
*Week 7 excluded
The most comparable game to the 49ers -who rank second in expected points added via pass defense- was when the Chiefs faced the team first in that category (the Patriots) in Week 14. In that game, Mahomes completed 26-of-40 passes (65.0%) for 283 yards with a touchdown and an interception while rushing for six yards (13.9 fantasy points).
Play-Action
Mahomes and the Kansas City offense are no strangers in incorporating the play-action pass. Mahomes used play-action on 31.4% of his dropbacks, the fourth-highest rate in the league. His 105.1 rating using play-action ranked 12th in the league where he averaged 8.0 yards per pass attempt and completed 65.7% of his passes. Those last two marks were actually slightly below the league rate. Here’s where Mahomes stacks up against the 49ers defense and the league this season when using play-action.
| Play-Action | Comp% | Y/A | TD% | Rating |
|---|---|---|---|---|
| Patrick Mahomes | 65.70% | 8 | 5.20% | 105.1 |
| SF D | 73.50% | 6.6 | 5.80% | 94.2 |
| League Average | 66.60% | 8.6 | 5.20% | 97.2 |
The 49ers defense was below the league rate in touchdown rate and completion rate allowed on play-action passes this season, but well above the mark on yards per pass attempt surrendered. The 49ers faced play action on 32.3% of the opposing dropbacks this season, but only faced five different passers that used play-action 30% of the time in an individual game.
| Week | Name | PA/DB% | Att. | Comp. | Comp % | Yards | Y/A | TD | Int |
|---|---|---|---|---|---|---|---|---|---|
| 5 | Baker Mayfield | 38.50% | 9 | 5 | 55.6 | 70 | 7.8 | 0 | 1 |
| 10 | Russell Wilson | 47.70% | 18 | 15 | 83.3 | 139 | 7.7 | 1 | 0 |
| 11 | Kyler Murray | 45.90% | 15 | 11 | 73.3 | 70 | 4.7 | 2 | 0 |
| 12 | Aaron Rodgers | 34.10% | 13 | 9 | 69.2 | 52 | 4 | 0 | 0 |
| 13 | Lamar Jackson | 58.30% | 13 | 10 | 76.9 | 85 | 6.5 | 1 | 0 |
| 16 | Jared Goff | 64.00% | 28 | 19 | 67.9 | 209 | 7.5 | 1 | 0 |
Interestingly enough, Mahomes was a far more efficient passer this season when the Chiefs went away from play action. His 110.2 rating and 8.6 yards per pass attempt without the use of play-action led the NFL. Here are the same numbers for Mahomes and the 49ers D compared to the league when they were using or facing play action.
| Non-Play Action | Comp% | Y/A | TD% | Rating |
|---|---|---|---|---|
| Patrick Mahomes | 66.0% | 8.6 | 6.5% | 110.2 |
| SF D | 57.9% | 5.8 | 3.8% | 68.3 |
| League Average | 62.5% | 6.9 | 4.2% | 89.2 |
Throwing Downfield
Given Mahomes’s arm strength and the Chiefs' plethora of speed on offense, it’s no surprise Mahomes leads the NFL in passer rating (125.9), passing yardage (1,743), and touchdown passes (15) on throws over 15 yards downfield this season. Here’s where he stacks up against the Niners defense on those downfield targets.
| Downfield Targets | Att% | Comp% | Y/A | TD% | Rating |
|---|---|---|---|---|---|
| Patrick Mahomes | 22.00% | 46.7% | 14.3 | 12.3% | 125.9 |
| SF D | 15.00% | 34.1% | 10.6 | 7.9% | 77.6 |
| League Average | 18.50% | 41.5% | 11.8 | 7.0% | 86.5 |
Mahomes was well above league rates across the board on downfield targets, especially making his money in the passing touchdown department. The touchdown rate area was the only soft spot for the 49ers defense defending downfield throws. Given their pass rush, it’s no surprise that teams got the ball downfield at a far lower rate than the league average. Only the Bills (4.2 per game) faced fewer downfield targets per game than the 49ers (4.9) defense. One note on the postseason so far is that the 49ers have allowed three pass plays of 40-plus yards on downfield targets in their two playoff games after allowing just four during the regular season.
Rushing Production
The newest development in Mahomes’s game has been the use of his legs. Now healed from a lingering early-season ankle injury and his dislocated kneecap, Mahomes has run 29 times for 255 yards (removing kneel-downs) over his past eight games after rushing 12 times for 87 yards over his first eight games played this season. Just once over his past eight games has he rushed for single-digit yardage. In the postseason, he’s flat out led the team in rushing each game, totaling 112 yards on the ground while the rest of the team has 124 combined rushing yards.
During the regular season, the 49ers were 30th in the league in rushing yards allowed to opposing signal-callers. Over their final 11 games of the season, six different passers ran for 25 or more yards against the Niners. The intriguing part of that production allowed on the ground by the 49ers is that they rarely blitz or play man-to-man defense, top-down schemes that inherently elevate rushing opportunities for mobile passers. Looking under the hood of the rushing production allowed by the 49ers, and there’s a common theme in the yards they have allowed rushing to quarterbacks and it’s from designed runs.
From Week 9 on, the 49ers have allowed 350 rushing yards to opposing quarterbacks. 208 of those yards stemmed from designed quarterback runs. All three rushing touchdowns allowed to quarterbacks over that span on designed runs. They allowed zone read scores by Kyler Murray in Week 11, and Lamar Jackson in Week 13 to go along with a sneak touchdown to Drew Brees in Week 14. Murray totaled 101 rushing yards in two games versus the 49ers with 97 of those yards coming on designed runs. All of Jackson’s 16 carries for 101 yards versus the 49ers came on designed runs.
That doesn’t mean the 49ers are completely immune to scrambling yards and passers extending plays. On the scramble yardage front, Russell Wilson did have 54 and 28 yards on passing play breakdowns while Matt Ryan added 28 scramble yards in Week 15. But that could come into play during the Super Bowl as all of Mahomes' rushing production is a byproduct of scrambles. He has 34 scrambles this season for 325 yards and three touchdowns while he had negative yardage on the designed run front (-1 yard) for the season. In 2018, he had 56 yards rushing on designed runs. If the Chiefs are game-planning Mahomes’s athleticism into their offense in the Super Bowl, one advantage could be to mix in a few actual designed runs or options to run against this 49er defense over solely relying on him scrambling and play extension in creating yardage with his legs.