As we continue to roll on through the offseason in preparing for the 2022 fantasy season we are taking a top-down look at the production for each position.
We starting things off by laying the groundwork with a league-wide stance on offense. How there was recoil in the 2021 season compared to the record-setting season we had across the board the year prior and what went into that regression.
In conjunction with that post, we then dug into the production and fantasy landscape for the quarterback and running back positions.
Next in line, we are taking a top-down look at the wide receiver position.
League WR Usage Per Game and League Rates Since 2010
| YEAR | TGT | League % | REC | Lg% | REYD | Lg% | RETD | Lg% |
|---|---|---|---|---|---|---|---|---|
| 2021 | 39.5 | 59.55% | 24.9 | 55.89% | 311 | 63.71% | 1.9 | 62.02% |
| 2020 | 40.6 | 60.02% | 26.5 | 57.79% | 334 | 65.53% | 2.1 | 61.42% |
| 2019 | 39.1 | 58.34% | 24.1 | 54.43% | 315.5 | 62.71% | 1.9 | 60.30% |
| 2018 | 39.5 | 58.84% | 24.9 | 55.51% | 318.9 | 62.67% | 2.1 | 62.81% |
| 2017 | 38.7 | 57.83% | 22.7 | 53.58% | 293.2 | 61.19% | 1.7 | 58.70% |
| 2016 | 42.6 | 60.60% | 25.5 | 56.72% | 326.3 | 63.82% | 2 | 63.74% |
| 2015 | 41.3 | 58.47% | 24.6 | 54.65% | 322.5 | 62.22% | 2 | 61.64% |
| 2014 | 41.3 | 60.07% | 24.8 | 56.63% | 323.6 | 64.26% | 1.9 | 60.10% |
| 2013 | 41.4 | 59.26% | 23.9 | 55.07% | 318.8 | 63.17% | 1.9 | 60.07% |
| 2012 | 41 | 59.88% | 23.6 | 55.81% | 315.7 | 64.17% | 1.9 | 64.86% |
| 2011 | 39.3 | 58.73% | 22.2 | 54.39% | 307.1 | 62.73% | 1.8 | 63.49% |
| 2010 | 39 | 58.68% | 22.3 | 54.34% | 295.8 | 62.61% | 1.9 | 63.91% |
If you have been following this series to this point, then you are already seeing something familiar in that the counting stats for wideouts dipped in 2021 after a record-setting 2020. We have covered the elements that went into propelling that 2020 season in detail and why regression was expected, but in terms of overall usage at the position, nothing was out of whack here.
After a dip in wide receiver target rate from 2017-2019, the 59.6% target share held by wideouts last season was just a shade below 2020 and the fifth-highest rate here out of the 12-year sample.
Receivers accounted for 55.6% of the league receptions (fourth highest), and 63.7% of the receiving yardage (fifth). All of those rates were the highest since 2016 outside of the 2020 eruption. Even with regression, wide receiver usage was strong in context of the modern era.
The position even saw a slight spike in percentage of leaguewide receiving touchdowns compared to 2020, which was the highest rate for the position in a season since 2018.
Taking in the complete sample here, the 2017 season was the rock-bottom of the position, which also coincides with one of the worst offensive seasons of the modern era, which surely is no coincidence.
Usage at the position remains strong and teams are incorporating wide receivers heavily into their offense, but we do appear to have leveled off in terms of the rate of offenses using three or more wideouts per dropback.
Percentage of Leaguewide Dropbacks Using 3 or More Wide Receivers
data per TruMedia
| Year | 3+WR% | 4+WR% |
|---|---|---|
| 2021 | 73.38% | 3.54% |
| 2020 | 73.49% | 3.80% |
| 2019 | 72.42% | 3.58% |
| 2018 | 75.28% | 2.52% |
| 2017 | 72.97% | 2.71% |
| 2016 | 75.27% | 4.80% |
| 2015 | 70.27% | 4.50% |
| 2014 | 69.56% | 3.43% |
| 2013 | 67.57% | 3.06% |
The TruMedia data only allows us accurate stats in this department going back to 2013, but you can see the difference in the rate of 3WR-plus sets per dropback at the start of the sample to where we currently are. 4WR-plus sets are still below 5% of all these dropbacks per season, so maybe there is potential for that to rise, but it does look like that 2018 season was the apex for usage of three or more wide receiver sets per passing play and has plateaued since.
Just about every team in your fantasy league has points at the wide receiver position due to the current era that is passing-rich. And when teams are planning to throw the football, three or more wideouts are on the field for nearly a third of those plays.
This has impacted the value of the WR1 in fantasy circles in recent years, with the WR2 and WR3 depth of fantasy scorers slowly creeping up into the rate in which they have matched premier scorers at the position.
Fantasy WR1 (Top-12) Share of Wide Receiver Production Since 2010
| WR1 | PPR PT % | TGT % | REC % | REYD % | RETD% |
|---|---|---|---|---|---|
| 2021 | 19.43% | 16.74% | 17.92% | 18.87% | 21.49% |
| 2020 | 18.05% | 15.53% | 16.49% | 17.52% | 23.73% |
| 2019 | 18.45% | 17.03% | 18.38% | 18.56% | 19.58% |
| 2018 | 20.15% | 18.11% | 19.68% | 20.33% | 21.24% |
| 2017 | 19.23% | 17.57% | 19.10% | 19.76% | 19.31% |
| 2016 | 17.88% | 15.78% | 17.07% | 17.50% | 22.09% |
| 2015 | 20.51% | 18.39% | 19.75% | 20.41% | 23.42% |
| 2014 | 20.36% | 16.79% | 18.37% | 20.39% | 25.36% |
| 2013 | 20.35% | 17.85% | 18.67% | 20.60% | 24.07% |
| 2012 | 20.31% | 18.28% | 19.74% | 21.04% | 20.86% |
| 2011 | 19.74% | 16.27% | 17.97% | 20.17% | 22.62% |
| 2010 | 19.11% | 17.21% | 17.80% | 19.23% | 24.27% |
On the surface level, WR1 production actually increased from 2020 in relation to the league. That said, we also have an all-time pantheon season from Cooper Kupp (more on him in a bit) that is anchoring that production. And even with that apex season from Kupp factored into the output, you can see that the WR1 scoring contributions from the position in 2021 are still among the lowest rates in the sample.
Even with Kupp’s 191 targets and his 31.7% team target share (44.2% of team-wide receiver targets), WR1 scorers accounted for 16.7% of the targets at the position. That is good for ninth in the 12-year sample, and only above 2020 over the past five seasons. The same can be said for the rate of receptions.
The rate of yardage and touchdowns are up over the previous two seasons, but also still rank ninth and eighth, respectively, at the position in the sample above.
Our Kupp OverFloweth
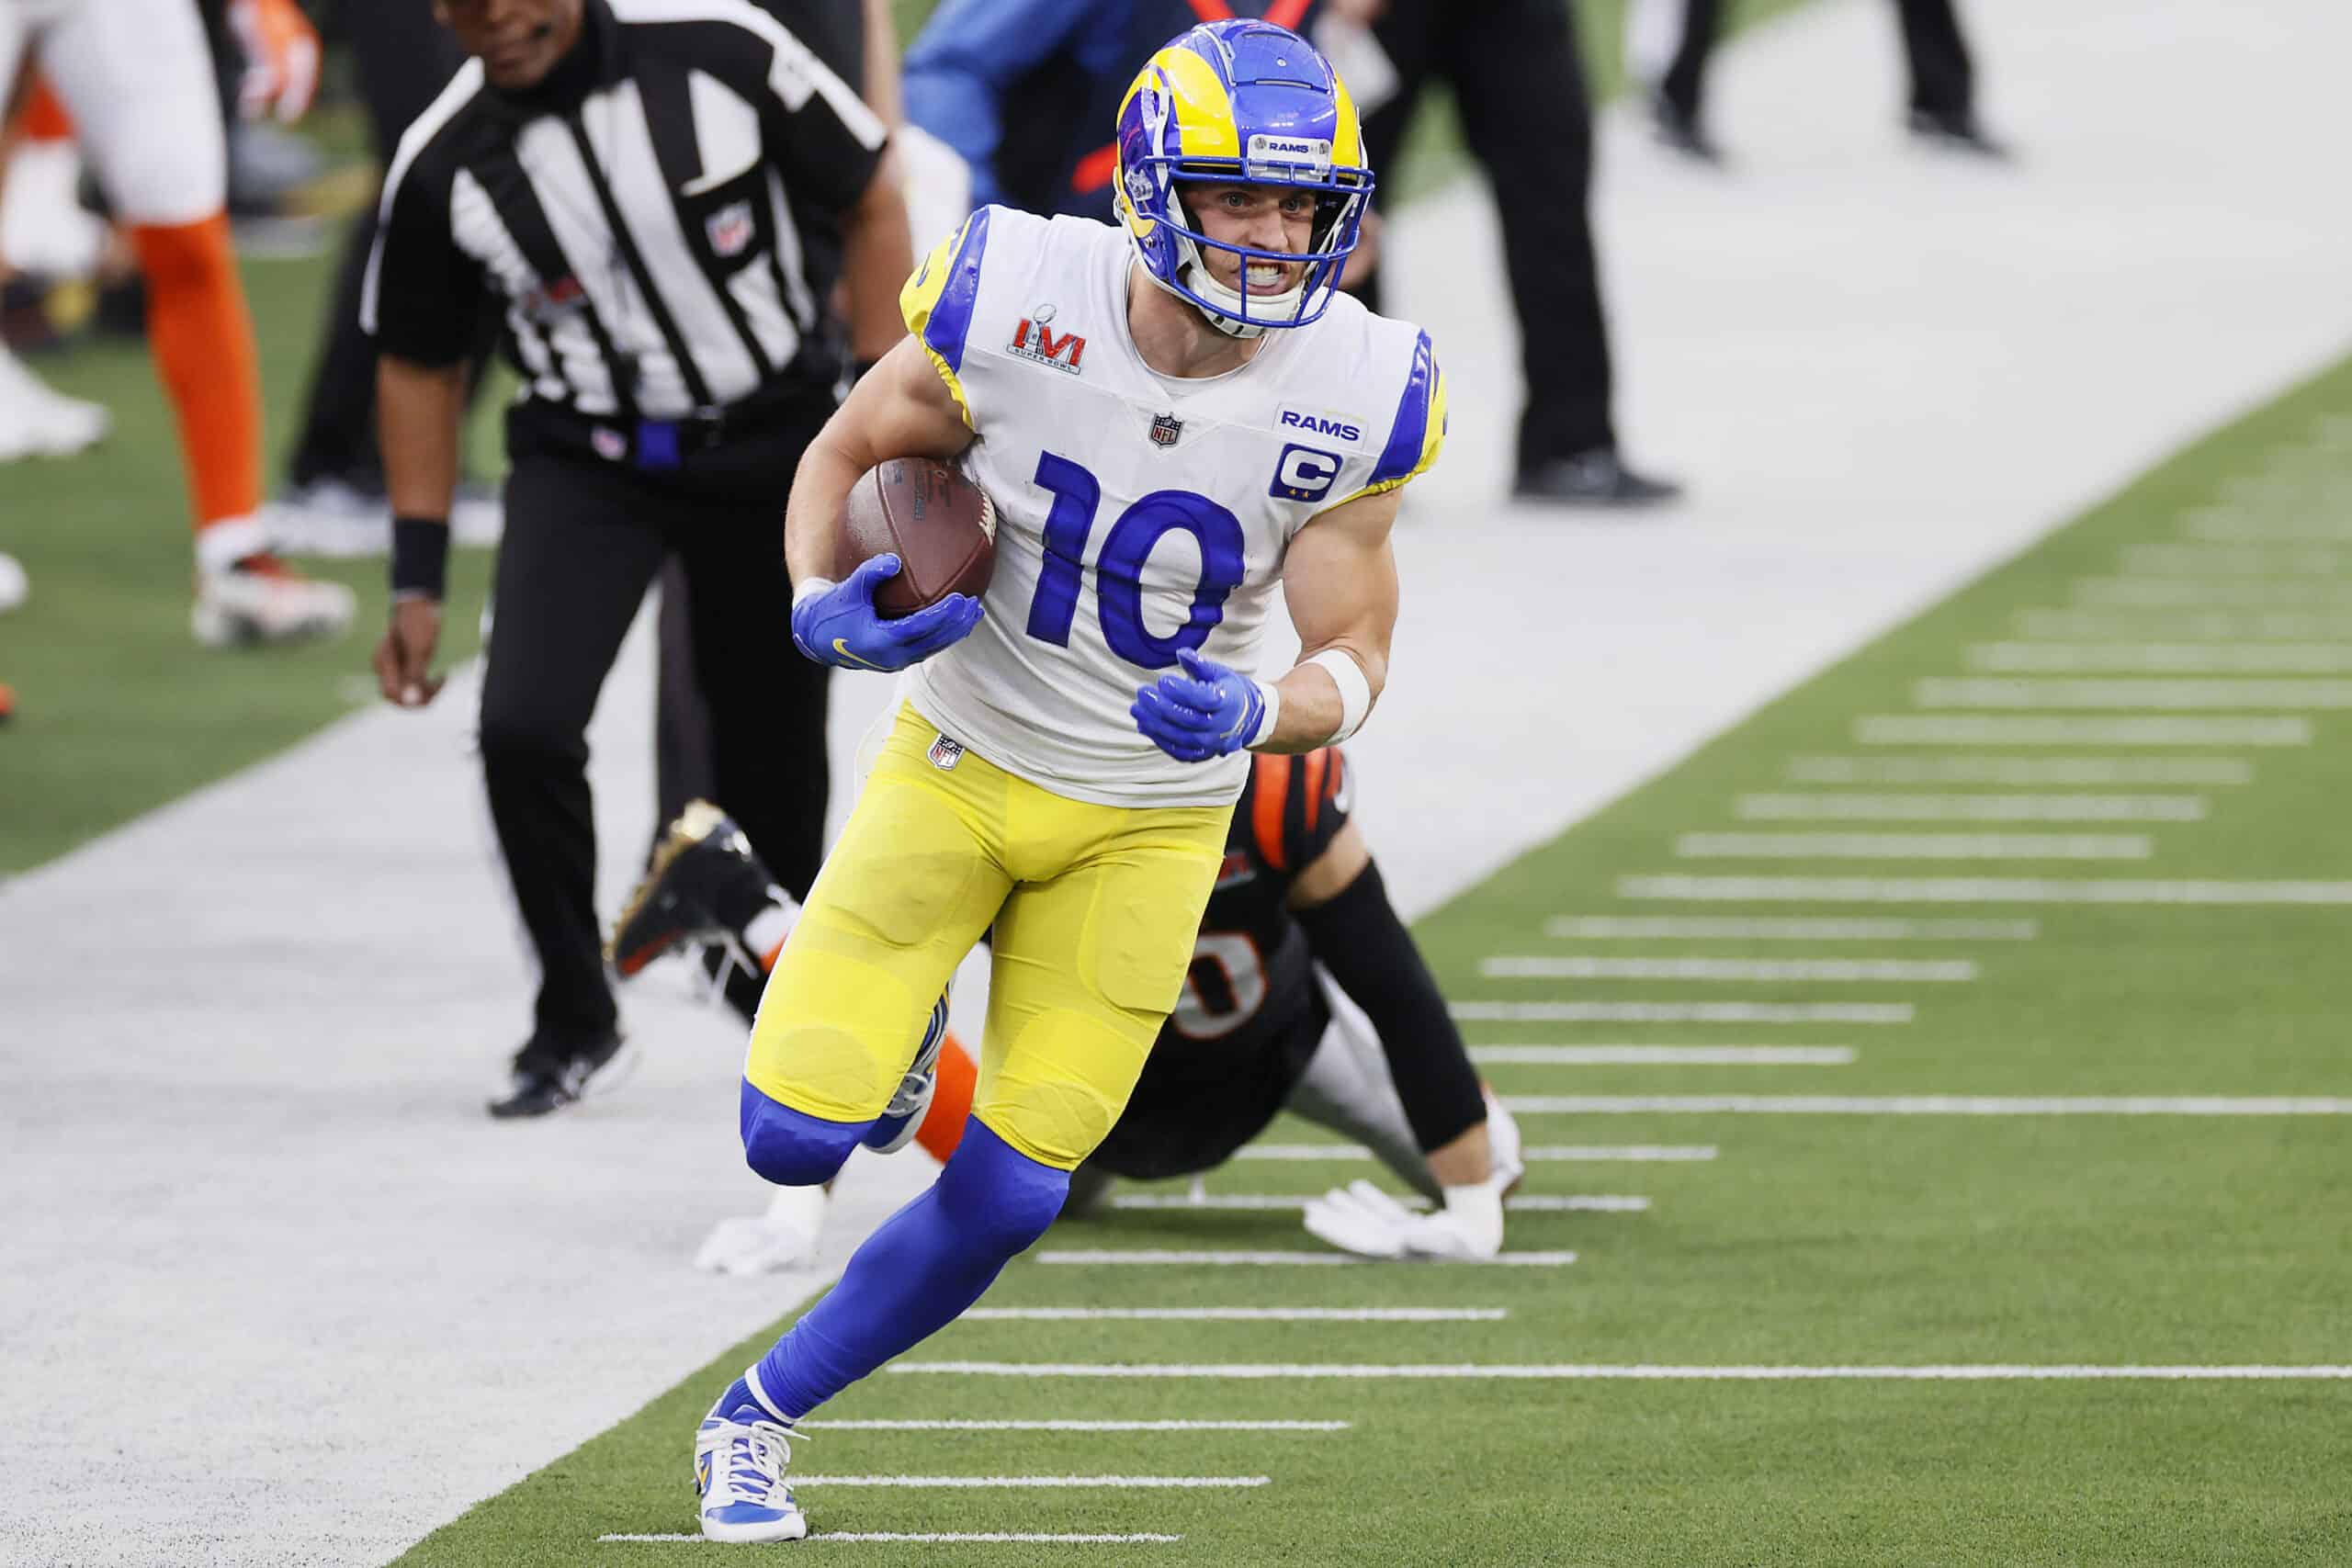
As everyone knows, Cooper Kupp’s 2021 campaign was one of legendary status, catching 145-of-191 targets for 1,947 yards and 16 touchdowns. He led the league in every major category as a pass catcher, on his way to a record-setting 439.5 PPR points for a wide receiver.
Even when accounting for the extra game into his counting stats, Kupp’s 3.21 yards per team pass attempt ranked fourth in any season since the merger while his 25.85 PPR points per game trailed only Jerry Rice’s 1995 season of 25.88 per game all-time.
From a positional leverage stance, Kupp eviscerated the field of top-20 pass catchers for fantasy to a degree we have not ever seen, including that 1995 season from Rice.
Comparing the 2021 field to Kupp to the field for 1995 Jerry Rice, the other 400-point WR scorer.
That 1995 season had three other wideouts clear 350 PPR points still. pic.twitter.com/Ps0xnVuovL
— Rich Hribar (@LordReebs) January 10, 2022
Kupp will be a talking point this offseason for anticipated regression this offseason, so I wanted to look into his season from a context of outproducing expectations.
Kupp did not completely come out of nowhere in terms of performing at a WR1 level. We have the front half of the 2019 season to draw back on for the upside he had in his range of outcomes.
That said, he was close to being a unicorn in terms of outproducing beliefs from a fantasy stance.
I have brought this up before, but we actually are solid at setting the fantasy market, with increasing accuracy as we progress.
Holding an average draft position within the position at WR20, Kupp was our first WR1 overall scorer that was drafted outside of the top three at the position in ADP since 2014. Going a step further, he was the only WR1 overall to be drafted below the WR7 in overall ADP since 2010, as far back as my data goes.
That alone adds to the mystique of his 2021 season and is hard to contextualize, but I am going to look at other massive, league-winner caliber seasons compared to ADP in an attempt to.
Being our first wide receiver to pace the position in points while also besting his ADP by 12 or more spots is already an outlier among outliers. Here are the other receivers to finish top-three in a given season while beating their preseason ADP by 12 or more spots and how they performed in their follow-up campaign.
WR1 Outperformed Preseason ADP BY 12+ Spots
*Current ADP per Underdog drafts from the previous seven days
| WR | Year | ADP | Finish | N+ ADP | N+ Finish | PPG | N+ PPG |
|---|---|---|---|---|---|---|---|
| Cooper Kupp | 2021 | 20 | 1 | 1* | TBD | 25.9 | TBD |
| Deebo Samuel | 2021 | 35 | 3 | 7* | TBD | 21.2 | TBD |
| Stefon Diggs | 2020 | 23 | 3 | 3 | 7 | 20.5 | 16.8 |
| Chris Godwin | 2019 | 19 | 2 | 6 | 31 | 19.7 | 15.9 |
| DeAndre Hopkins | 2017 | 14 | 2 | 2 | 1 | 20.7 | 20.8 |
| Keenan Allen | 2017 | 15 | 3 | 6 | 12 | 17.8 | 16.3 |
| Brandon Marshall | 2015 | 26 | 3 | 26 | 49 | 21.2 | 10.5 |
| Antonio Brown | 2013 | 22 | 3 | 7 | 1 | 19.3 | 23.8 |
| Josh Gordon | 2013 | 35 | 2 | 48 | 102 | 22.5 | 10.9 |
| Wes Welker | 2011 | 15 | 2 | 4 | 7 | 21 | 18.1 |
| Dwayne Bowe | 2010 | 18 | 3 | 12 | 14 | 17.4 | 14.3 |
We also get Deebo Samuel here from last season to add to the fun and increase an inherently minuscule sample of just nine players prior to last year.
You can also immediately see how rare it is to have a wide receiver completely breakout to this degree paired with reduced ADP. Only three of the wideouts here were selected as WR3 or lower, with Samuel and Gordon being the lowest of the group.
The highest scoring finish over this sample from a wideout selected as a WR4 or later was from Jordy Nelson in 2011 (WR4 overall, WR45 in ADP) as the only top-five scorer.
Among those nine players prior to Kupp and Samuel last season, all saw their ADP in the following season climb to WR1 status outside of Josh Gordon in 2014 and Brandon Marshall in 2016. Gordon was suspended for the entirety of the 2014 season right before that season (August 27), and then had that sentence reduced to 10 games after the season had already begun.Marshall was 32 years old in 2016 and nearly nobody stocked Ryan Fitzpatrick replicating his 2015 season. The suspension and age apex clearly (correctly )inflected both costs.
Gamers were already accounting for Gordon’s suspension and Marshall’s potential to fall off the age cliff, and those are the only two players here who absolutely saw their per game fantasy output crater.
Only Antonio Brown in 2014 and DeAndre Hopkins in 2018 scored more points per game than their breakout season (also the only two here that were the top scorer overall the next season), but only Gordon and Marshall lost more than 3.8 points per game off their pace from the year prior. If either Kupp or Samuel stays within that realm of regression, you are still looking at strong performers, even if not getting the full return on investment.
Chris Godwin in 2020 and Dwayne Bowe in 2011 were the other wideouts here to not finish as WR1 scorers the following season. Godwin missed four games, but modestly was WR15 in points per game that season. Bowe ended up as the WR14 (WR20 in PPG) in his follow-up.
If Kupp or Samuel landed in the WR15-20 area in points per game, they surely would be disappointments paired with cost, but it is unlikely that type of season would break you.
With Matthew Stafford and Sean McVay still in place, Kupp has room to concede some overall production from his 2021 totals and still be a strong fantasy wideout.
Samuel is a little more unique with his one-of-one usage that flipped midseason in 2021 while being paired with an unknown variable in Trey Lance starting. Oh, we also need to make sure he doesn’t hold out and this schism with the franchise gets sorted out prior to the season.
That said, Samuel has only ever produced when active on the football field. Samuel has now played two-thirds of the snaps in 29 career games, finishing as a WR1 in 11 of those games and averaging 17.7 points per game, scoring single-digit points in just four of those games.
Now, I would never suggest a sample this small has any true accuracy merits, but both players here are in good company in avoiding bottoming out.
No way I am reading all of this…
- Wide receivers continued to bounce back in 2021 usage compared to the 2017-2019 seasons.
- More wide receivers are on the field per dropback than a decade ago, but that appears to plateaued in recent seasons.
- The increased usage of more wide receivers per dropback has impacted the usage of fantasy WR1 scorers in context of the position.
- Cooper Kupp provided an all-time season in context of pre-draft expectations, but still resides in good company among the few to do so prior.