

Every offseason, I break down the NFL offensive trends that will shape the upcoming season, including a deep dive into how quarterbacks have scored fantasy points in recent seasons.

The goal for these articles is straightforward.

We are monitoring the league's current state to identify any outliers, which we can then incorporate into the upcoming season while also gauging league trends.

While we have already examined all the positional tiers for 2026, it is always beneficial to review the league's overall landscape.

Every NFL season is unique, so this is always a great way to lay some groundwork.

2026 Fantasy Football Odds & Trends
Draft Kit Hub
2026 League Trends
Quarterback Trends
Running Back Trends (Coming soon)
Wide Receiver Trends (Coming soon)
Tight End Trends (Coming soon)
NFL Team Per Drive Trends (Coming soon)
NFL Red Zone Trends (Coming soon)
NFL Yardage to Touchdown Trends (Coming soon)
Touchdown Trends (Coming soon)
Red Zone Regression: Quarterbacks (Coming soon)
Red Zone Regression: Running Backs (Coming soon)
Red Zone Regression: Wide Receivers (Coming soon)
Red Zone Regression: Tight Ends (Coming soon)

Don't Miss Out on The Best Fantasy Football Coverage in the Business

Like the NFL, fantasy football never sleeps.

From rankings to the best draft strategies, Sharp Football has everything you need to get ready for the fantasy season in our Fantasy Football Draft Kit, powered by premier fantasy football analyst Rich Hribar.

Save more by bundling the Draft Kit with our in-season fantasy package that features Rich's comprehensive “Worksheet” preview of every game, every week of the NFL season.

Click here for more information about our fantasy coverage!

Leaguewide Passing Output Since 2010

YEARATT/GMCOMP%PaYD/GMY/APaTD/GmPaTD%RATINGPass FPPG
202564.464.3%420.97.02.994.65%91.426.8
202465.765.3%436.87.12.994.54%92.327.8
202367.664.5%439.57.02.784.12%89.026.9
202266.764.2%437.07.02.774.15%89.126.7
202168.864.8%456.67.13.094.48%90.828.6
202070.465.3%480.37.23.404.83%93.630.9
201969.763.5%469.97.23.114.46%90.429.4
201869.064.9%475.57.43.314.79%92.930.3
201768.362.1%448.77.02.894.24%85.127.4
201671.563.0%483.17.23.074.30%87.629.5
201571.563.0%487.77.33.294.60%88.430.5
201469.862.6%473.67.23.154.51%87.129.2
201370.861.2%471.27.13.144.43%84.128.8
201269.560.9%462.67.12.964.26%83.827.9
201168.060.1%459.47.22.914.28%82.527.3
201067.560.8%443.27.02.934.35%82.226.6

One thing I want to lead with is that passing in the NFL is not poor.

The league just isn't throwing the ball as much.

Passing volume continues to dwindle for the league as a whole.

The league has had a dropback rate below 60% in three of the past four seasons.

Last year’s 59.2% dropback rate was the lowest in a season since 2011.

2025 saw the fewest pass attempts per game for the league since 2006.

Passing yardage per game also dropped to its lowest total since 2006.

While the league has lost volume and yardage, teams have still been solid at getting the ball into the end zone through the air.

After 809 touchdown passes in 2024, the league put the ball into the end zone 811 times through the air last year.

The 4.7% touchdown rate rose for the second straight season and was the highest the league has seen since 2020.

Completion percentages slipped a tick last year, while yards per pass attempt have been stagnant over the past five seasons.

That last point is a bit disappointing since we covered yesterday that the league has found increased answers through rising play-action and pre-snap motion rates.

Not shown here, but the air yards per pass attempt average was exactly on par with recent trends, checking in at 7.7 yards downfield per attempt, the same number we have had four years in a row.

It was the sixth season in a row with air yards per attempt below 8.0 yards downfield, after 14 consecutive years with a depth of throw over 8.0 yards downfield as a whole.

In short, this reinforces what we have largely known.

Teams are throwing the ball less and throwing shorter passes downfield overall.

Deep Passing Output Over the Past 10 Seasons

YearAttCompComp%TDTD%
2025200073336.6%1688.4%
2024203070634.8%1698.3%
2023214976835.7%1617.5%
2022204272835.8%1617.9%
2021215279637.0%1667.7%
2020202876537.7%1959.6%
2019218478836.2%1828.3%
2018210874035.1%1909.0%
2017210270133.3%1677.9%
2016213076235.8%1858.7%

*Throws 20 or more yards downfield

Once again, efficiency is up here on deep throws.

The league completed the highest rate of deep throws since 2021 while posting the highest touchdown rate on those throws since 2020.

The league completed 27 more of those passes last year than in 2024 despite 30 fewer attempts.

The league wasn't throwing the ball enough overall for that efficiency to shine through and drive fantasy points.

The touchdown production has kept us afloat for fantasy to some degree.

Still, you can feel the collective impact across several arbitrary measures that the sport has leaned on as markers for solid passing production.

QBs to Hit Statistical Thresholds Since 2010

YEAR200+Yards/Gm250+Yards/Gm3K Yards4K Yards25+PaTD30+PaTD40+PaTD
2025235216941
20242781961053
2023251019101040
20222610179841
2021291224101192
20202816181212103
201928162511840
2018291921121391
201722112281030
2016271725131351
20153118231214100
2014281522111291
201330112191151
201225122410951
20112612209953
201025102251050

*Min. 8 games played

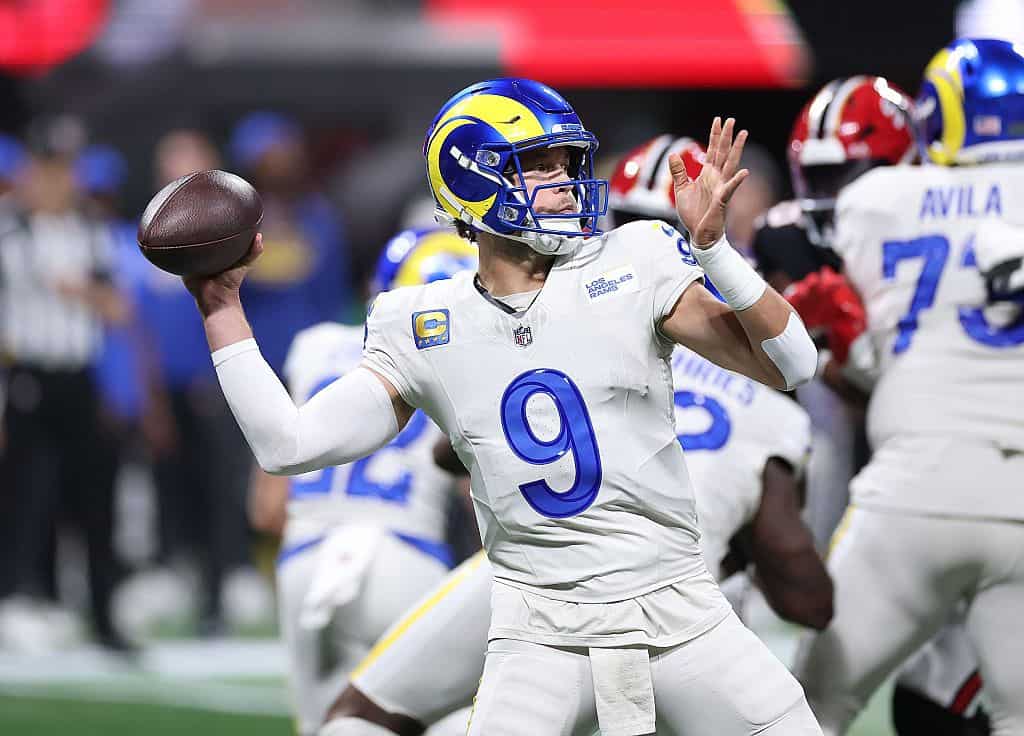
Matthew Stafford led the NFL with 276.9 passing yards per game last season.

That was the seventh-best season in passing yardage per game for his career.

It was the lowest average for a league leader in passing yards per game since Peyton Manning in 2003 (266.7 yards per game).

Last season saw the fewest passers throw for 200 yards or more and 250 or more yards per game in the sample above.

Only 23 passers averaged 200 or more passing yards per game last season.

Only five (Stafford, Jared Goff, Dak Prescott, Drake Maye, and Patrick Mahomes) threw for 250 or more yards per game.

It was the third year in a row that no passer averaged 300 passing yards per game.

A few more players threw for at least 3,000 yards last year than in the previous three seasons, but only six reached 4,000 passing yards for the second year in a row.

Keep in mind that the NFL went to 17 games in 2021.

Touchdown rates have climbed in the past two seasons, but the table above shows how high-end passing touchdowns are still tough to come by.

On average, we are getting one player per season throwing for 40 or more passing scores, while we have not had more than five players throw for 30-plus passing touchdowns in a season since 2021.

Five or more quarterbacks hit that mark in 10 of the 12 seasons before the NFL added a 17th game to the schedule.

With overall production depressed, the depth of the position has been more viable.

QBs to Hit Fantasy Football Thresholds Since 2010

YEAR15+ Pass Pts/Gm20+ Pass Pts/Gm
202571
202471
2023101
202291
2021121
2020174
2019161
2018192
2017120
2016124
2015202
2014150
2013132
201281
201184
2010110

Over the past two seasons, we have had only seven players each year who averaged 15-plus passing points per game.

Jared Goff and Joe Burrow are the only players to have hit that arbitrary mark in each of the past two years.

The top-end passers per season have gained less leverage over the field in recent seasons, something we will explore in greater detail (spoiler alert) in our ADP series, since gamers have run cold in recent seasons selecting quarterbacks at the top of drafts the past few years.

Josh Allen has remained a consistently good pick at the top of drafts, but over the past two seasons, nine of the 12 top-six scorers at the position in each season have been selected as the QB7 or lower.

Eight of those players were selected as the QB10 or lower in drafts.

That is why Allen has the widest gap to the field at the position entering 2026 compared to anyone else.

If you aren’t taking Allen, waiting longer at the position has paid off significantly over the past two years.

We discussed this yesterday, but the signal the NFL has sent us heading into 2026 does not inspire confidence that the league as a whole will shift to a more aggressive passing approach, making it hard to lean into playing the front end of the quarterback market aggressively in drafts again this season.

With passing production being limited due to league-wide trends in passing volume, rushing output is a larger factor for fantasy points, but even that department took a hit last year.

Quarterback Rushing Output Since 2010

YEARRuATTLeague%RuYDLeague%RuTDLeague%Rush FPPGScramble%Design/Game
2025226715.5%980015.4%10821.2%5.985.6%4.30
2024235216.0%1103316.9%10720.9%6.425.3%4.74
2023236616.2%984016.1%11424.3%6.135.1%4.86
2022233115.8%1046115.9%10321.2%6.124.6%5.19
2021217115.0%944215.1%9919.6%5.664.5%4.55
2020214815.6%942415.5%12623.7%6.244.4%4.68
2019182513.6%769813.3%8017.9%4.594.1%3.73
2018187114.1%808513.8%7116.2%4.544.1%3.89
2017164812.0%712512.7%6617.4%4.083.9%3.29
2016152211.4%600610.8%6514.7%3.643.4%3.11
2015162112.0%654911.8%6116.7%3.753.6%3.30
2014164712.0%664811.7%4712.4%3.483.7%3.41
2013170712.3%726612.6%5713.9%3.933.8%3.47
2012159611.5%667211.2%6917.2%3.983.5%3.36
2011159211.4%615810.3%6616.5%3.723.7%3.21
2010142010.2%55399.5%4411.0%3.013.4%2.83

In 2025, quarterbacks rushed for their fewest points per game since 2021.

The 15.5% share of leaguewide rush attempts and 15.4% of the rushing yardage were also lows since that 2021 season.

Quarterbacks still made an impact in the touchdown department, accounting for 21.2% of the league’s rushing scores.

Since 2020, we have seen a spike in rushing touchdowns at the position, just barely missing 100 in each of the past six years, having never sniffed that number before.

One thing to account for in 2025 is that several quarterbacks capable of rushing output missed significant time.

Had Lamar Jackson, Jayden Daniels, and Kyler Murray played a full season last year, they would have lifted the tide in several areas.

Add Malik Willis and the potential for a full season for Jaxson Dart and Tyler Shough to the mix, and it's easy to sell yourself on a bounce-back for top-down output among the rushing quarterbacks.

We have been following quarterback rushing, not with an eye on when that bubble might burst in terms of falling apart or going away, but how high things could climb and where the cap could settle in.

I expect rushing to be higher for the position this year, but the more interesting thing here, in my opinion, is how much the designed rushing usage rebounds.

Obviously, those guys being hurt played a role in designed rushing attempts dropping for the third consecutive season at the position.

Still, when paired with the fact current offenses are playing more and more under center, I do question if that is something we continue to see squeezed.

We saw this with Jalen Hurts last year.

Hurts averaged 3.3 designed runs per game, easily his lowest as a starter.

From 2021 to 2024, Hurts averaged 5.2, 6.7, 5.8, and 6.0 designed runs per game.

While Jackson, Daniels, and Murray are all set to be back this season, all three passers (and Hurts) will see significant scheme changes in 2026.

Changes where we anticipate them taking more snaps under center, which can impact the rate of designed runs and RPO opportunities for those players.

The rate of designed rushing is something we are going to have to let breathe, but the positive aspect above (for fantasy) is that the quarterback's athleticism was still on display last year through scrambling.

Passers continue to scramble at a higher rate, a trend that has increased since the year before in six straight seasons.

Last year, we had eight different quarterbacks scramble for 300 more yards, six clear 350 scramble yards, and four clear 400 yards via leaving the pocket on a dropback to pass.

We are getting Daniels (15.7% scrambling rate), Murray (8.8%), and Jackson (8.2%) back as top-10 players in scramble rate a year ago, while a full season from Dart (9.2%) is going to add a handful of rushing yards to the league.

Willis had a 14.5% scramble rate with Green Bay, which was the highest in the league.

2025 also saw career highs in scramble rate from Patrick Mahomes (9%), Justin Herbert (8%), and Trevor Lawrence (6.7%).

Drake Maye has a scrambling rate of 10% in each of his first two seasons.

Rushing production at quarterback is still alive and well and a difference-maker for weekly ceiling potential.

Still, if the trend of designed runs continues to dip in 2026, then those spike weeks and fantasy floors become more volatile for those who lean more into rushing-dependent players.

This is why gamers have sharply valued Matthew Stafford where he is in drafts and why Goff has never pushed a high-end ADP despite his consistency as a top-end passer in recent years.

That does not make those guys bad picks at all, but in a complete ceiling outcome, the guys who can pass and run still have access to larger spike weeks.

In Stafford’s amazing 2025 campaign, his highest-scoring fantasy game ranked 19th-best among quarterbacks.

Among quarterbacks who were QB1 scorers each week over the season, the group averaged 7.8 rushing points per game.

The top three weekly scorers each week over the year averaged 5.9 rushing points per game.