

Every offseason, I break down the NFL offensive trends that will shape the upcoming NFL season.
The goal for these articles is straightforward.
We are monitoring the league's current state to identify any outliers, which we can then incorporate into the upcoming season while also gauging the league's trends.
While we have already examined all the positional tiers for 2026, it is always beneficial to review the league's overall landscape.
Every NFL season is unique, so this is always a great way to lay some groundwork.
Don't Miss Out on The Best Fantasy Football Coverage in the Business
Like the NFL, fantasy football never sleeps.
From rankings to the best draft strategies, Sharp Football has everything you need to get ready for the fantasy season in our Fantasy Football Draft Kit, powered by premier fantasy football analyst Rich Hribar.
Save more by bundling the Draft Kit with our in-season fantasy package that features Rich's comprehensive “Worksheet” preview of every game, every week of the NFL season.
Click here for more information about our fantasy coverage!
NFL Scoring Trends Since 2017
| Category | 2025 | 2024 | 2023 | 2022 | 2021 | 2020 | 2019 | 2018 | 2017 |
|---|---|---|---|---|---|---|---|---|---|
| Combined Points/Gm | 46.0 | 45.8 | 43.5 | 43.8 | 46.0 | 49.6 | 45.6 | 46.7 | 43.4 |
| Offensive TD | 1323 | 1323 | 1225 | 1241 | 1348 | 1405 | 1244 | 1286 | 1121 |
| Team Off TD/Gm | 2.43 | 2.43 | 2.25 | 2.28 | 2.47 | 2.74 | 2.4 | 2.53 | 2.21 |
| Rush TD | 510 | 511 | 470 | 487 | 505 | 532 | 447 | 439 | 380 |
| Pass TD | 811 | 809 | 754 | 750 | 840 | 871 | 797 | 847 | 741 |
| Yards Gained Per TD | 134.3 | 139.1 | 147.4 | 149.0 | 138.9 | 131.0 | 143.2 | 140.2 | 152.6 |
| Scoring Drive % | 39.6% | 38.8% | 37.1% | 37.9% | 39.5% | 41.7% | 37.5% | 37.9% | 35.2% |
| TD Drive % | 23.2% | 22.7% | 21.3% | 21.9% | 23.9% | 26.4% | 22.8% | 23.4% | 19.9% |
| Red Zone Drive % | 30.6% | 30.4% | 28.6% | 29.9% | 31.9% | 32.9% | 30.0% | 29.4% | 26.8% |
| Red Zone TD % | 57.3% | 57.6% | 57.3% | 56.1% | 58.5% | 62.0% | 56.1% | 58.8% | 52.4% |
You are likely wondering why I arbitrarily used the year 2017.
2017 was the previous low point for the NFL collectively on offense, providing a useful baseline for the game's growth from that down season.
Since that year, we have navigated the impact of the pandemic, rule changes, and a current defensive era, during which teams began to find answers in 2024 that carried over into last year.
It is almost jarring how similar the 2025 season was to the 2024 campaign, which is why much of the top-down fantasy team-building from 2024 carried over and propelled gamers to titles last year.
It is not always as easy as “what worked last year will work again,” and there were some changes we will uncover through this week's series to highlight for application this year, but NFL offenses produced nearly identical outcomes over the past two seasons.
Offensive touchdowns were equal, and the split of scores between rushing and passing was right in line with the previous season.
Outside of the heaviest COVID-influenced 2020 season, you can see that offenses are largely in the ballpark (and better in areas) than the steep decline we had coming out of the COVID seasons.
There were slight upticks in the efficiency metrics per drive, which once again stemmed from tweaks to the kickoff rules.
How the New Kickoff Rules Changed NFL Scoring in 2025
In 2024, the NFL introduced “dynamic” kickoffs and altered touchbacks to start at the 30-yard line.
We saw more kickoffs returned in 2024 than in previous seasons, but the NFL still wanted to see more returns and to have them as part of the game.
As an alteration, just one year in, touchbacks were moved to start at the 35-yard line.
That change made an impact.
NFL Possessions That Begin With a Kickoff
| Year | Touchback% | Pts/Drive | Score% | TD% | FG% | Avg. Start |
|---|---|---|---|---|---|---|
| 2025 | 20.7% | 2.13 | 39.6% | 23.7% | 15.9% | 30.8 |
| 2024 | 64.4% | 2.00 | 37.4% | 22.3% | 15.2% | 30.0 |
| 2023 | 73.1% | 1.77 | 33.0% | 19.6% | 13.4% | 25.5 |
| 2022 | 59.8% | 1.87 | 35.1% | 20.6% | 14.4% | 25.8 |
| 2021 | 57.8% | 1.88 | 34.6% | 21.4% | 13.1% | 25.3 |
| 2020 | 61.3% | 2.07 | 37.2% | 24.3% | 12.9% | 25.7 |
| 2019 | 61.1% | 1.84 | 33.9% | 20.7% | 13.2% | 25.4 |
| 2018 | 60.9% | 1.88 | 34.0% | 21.9% | 12.0% | 25.6 |
| 2017 | 57.0% | 1.70 | 32.2% | 18.6% | 13.6% | 25.1 |
| 2016 | 57.9% | 1.81 | 33.4% | 20.4% | 13.0% | 25.2 |
With teams being penalized for kicking the ball into or through the end zone at a higher rate, touchbacks plummeted to historic lows last year.
Only 20.7% of kickoffs resulted in a touchback.
Only one team had a touchback rate of 50% or more, which was the Rams at 57.3%.
The next closest team was the Jaguars at 38.1%.
Only five other teams had a touchback rate of 25% or higher.
The Colts (5.9%) and Steelers (8.0%) were in the single digits.
After 919 kickoff returns in 2024, that spiked to 2,076 last season!
As a result, the league recorded a record 53,869 kickoff return yards.
In 2024, that number was 25,385 yards.
91.6% of all kickoff returns started past the 20-yard line, a new record.
We still have not seen a spike in kickoff return touchdowns under the new rules (there were 6 last season and 7 in 2024), but that is kind of a feature for fantasy gamers, not having those touchdowns go to other players while setting up our skill players to get into the end zone at a higher rate.
We have had double-digit kickoff return touchdowns in just one season since 2011.
Paired with touchbacks coming out to the 35, the average starting field position for the return team was at the 30.8-yard line, the highest rate.
With shorter yardage to go (even if only a handful of yards), offenses produced their highest points-per-drive and scoring rates-per-drive after a kickoff over the past 10 years.
The touchdown rate per drive after a kickoff was the second-highest over that span.
With shorter fields and long-range field-goal kicking in an unparalleled space, field goals per drive after a kickoff were an all-time high.
Long-Range Fields Made By Season Over the Past 10 Years
| Year | 40-49 | 50-59 | 60+ |
|---|---|---|---|
| 2025 | 264 | 183 | 12 |
| 2024 | 231 | 195 | 4 |
| 2023 | 219 | 158 | 5 |
| 2022 | 247 | 154 | 5 |
| 2021 | 236 | 120 | 4 |
| 2020 | 245 | 106 | 1 |
| 2019 | 232 | 84 | 2 |
| 2018 | 224 | 97 | 2 |
| 2017 | 254 | 107 | 2 |
| 2016 | 235 | 85 | 1 |
If you've thought field goal kickers have had the best legs of any previous generation in the sport, you’re not wrong.
Last year saw the most field goals made from 40-49 yards and 60-plus yards ever.
NFL teams attempted 22 field goals of 60-plus yards last season.
16 different kickers attempted a 60-plus-yard field goal, with nine successfully drilling them through the goalposts.
Brandon Aubrey (3) and Cam Little (2) connected on more than one of those kicks.
Kickers made 54.5% of those attempts.
From 2000 to 2024, they had made 26.4% of those attempts.
How NFL Offenses Are Countering Modern Defenses
There has always been a consistent pendulum of counterpunching between offense and defense.
The league as a whole is constantly adapting and borrowing from what is successful on both of the ball and what works against both.
When something works for a team, the other 31 teams (well, the good ones) will try to incorporate it into their plans.
Coming out of the 2020 season, NFL defenses gained an upper hand by playing more shell coverage, fielding more defensive backs, and playing lighter fronts.
The premise was to prevent big plays and force offenses to run more plays.
Defensive Personnel Trends Over the Past Decade
| Year | Man% | MOFO% | Blitz% | Nickel | Dime |
|---|---|---|---|---|---|
| 2025 | 22.6% | 45.7% | 25.9% | 59.1% | 9.3% |
| 2024 | 26.0% | 43.4% | 25.3% | 65.1% | 9.8% |
| 2023 | 24.0% | 43.8% | 26.0% | 67.2% | 9.8% |
| 2022 | 24.4% | 42.2% | 25.8% | 63.3% | 10.4% |
| 2021 | 27.9% | 40.8% | 25.3% | 60.8% | 13.4% |
| 2020 | 30.8% | 39.1% | 28.4% | 58.9% | 13.8% |
| 2019 | - | - | 27.6% | 55.4% | 14.8% |
| 2018 | - | - | 25.7% | 59.3% | 12.9% |
| 2017 | - | - | 27.3% | 51.4% | 12.2% |
| 2016 | - | - | 27.6% | 55.8% | 11.7% |
| 2015 | - | - | 29.1% | 50.2% | 11.9% |
| 2014 | - | - | 28.8% | 46.6% | 12.4% |
| 2013 | - | - | 29.9% | 45.2% | 11.7% |
*MOFO% = Middle of Field Open Pre-Snap
Last season saw a return to more two-high coverages and the middle of the field open pre-snap.
That came in the form of quarters coverage, which was run at a 14.4% rate, the highest recorded in our sample seasons.
Quarters allows the defense to max-fit the run game by involving both safeties, something relevant since we are seeing a lower rate of sub packages on defense.
Defenses dialed back man coverage.
Cover 1 saw a 17.4% rate, the lowest in the sample seasons.
The biggest changes we saw last year were that offenses continued to manipulate defenses out of sub-packages.
Nickel coverage had the lowest play rate since 2020, while dime coverage was played at the lowest rate over our sample, the third straight year in single digits.
Offenses were able to do this by continuing to run heavier sets as a counter.
The Shift Toward Heavy Personnel
| Year | Under Center | 3+WRs | 2+TE | 6+OL |
|---|---|---|---|---|
| 2025 | 34.8% | 57.9% | 33.4% | 5.3% |
| 2024 | 30.3% | 62.6% | 30.2% | 2.9% |
| 2023 | 28.7% | 64.8% | 27.0% | 2.6% |
| 2022 | 33.0% | 62.9% | 27.8% | 3.1% |
| 2021 | 34.6% | 62.3% | 28.8% | 3.9% |
| 2020 | 34.8% | 62.8% | 28.8% | 2.7% |
| 2019 | 36.1% | 62.0% | 28.2% | 4.4% |
| 2018 | 36.8% | 65.4% | 25.1% | 3.2% |
| 2017 | 41.2% | 61.3% | 29.4% | 3.7% |
| 2016 | 36.4% | 64.4% | 25.3% | 5.7% |
Offenses continued to get under center after an uptick in 2024.
Playing under center facilitates two core components of the current offensive engine: more play-action passing and pre-snap motion.
NFL Passing Under Center vs. Shotgun in 2025
| Dropback | Y/A | PA% | TD% | Blitz/DB% | Motion% |
|---|---|---|---|---|---|
| Shotgun | 6.9 | 12.5% | 4.2% | 23.2% | 48.5% |
| Under Center | 7.8 | 85.7% | 6.6% | 40.0% | 67.4% |
When you are in a static shotgun situation, you lose more offensive leverage.
That is not always the case in neutral game scripts, as offenses like the Colts, Eagles, and Ravens have had success in recent seasons when everything is in order.
Still, when you are in a static dropback game out of shotgun, you are fighting with a hand tied behind your back and allow the defense to know the assignment.
NFL Plays With & Without Motion Since 2020
| Year | Run Motion% | Yd/Play | Without | Dropback Motion % | Yds/Play | Without |
|---|---|---|---|---|---|---|
| 2025 | 56.5% | 4.5 | 4.1 | 51.9% | 6.2 | 5.9 |
| 2024 | 54.2% | 4.5 | 4.3 | 49.2% | 6.3 | 6.1 |
| 2023 | 53.0% | 4.3 | 4.1 | 45.2% | 6.3 | 5.8 |
| 2022 | 54.9% | 4.6 | 4.2 | 44.4% | 6.0 | 6.2 |
| 2021 | 49.4% | 4.4 | 4.3 | 40.0% | 6.3 | 6.2 |
| 2020 | 49.1% | 4.6 | 4.3 | 38.9% | 6.4 | 6.4 |
We saw the highest rate of plays with six or more offensive linemen on the field since 2016.
Offenses ran three or more wide receivers on the field at the lowest rate since 2014.
After finding success with multiple tight end sets in 2024, the league built on that last season with another surge in those snaps.
The marriage of those last two components is how offenses have been able to get defenses to match personnel and play heavier themselves.
Teams are not getting bigger to just run, but also to throw.
NFL Pass Plays Out of Heavy Sets
| Year | Under Center | 2+TE | 6+OL |
|---|---|---|---|
| 2025 | 17.9% | 25.3% | 2.3% |
| 2024 | 15.3% | 22.6% | 1.0% |
| 2023 | 14.0% | 20.3% | 1.1% |
| 2022 | 17.0% | 19.7% | 1.1% |
| 2021 | 17.8% | 20.6% | 1.6% |
| 2020 | 19.1% | 21.4% | 1.0% |
| 2019 | 19.7% | 20.7% | 1.6% |
| 2018 | 20.1% | 18.2% | 1.3% |
| 2017 | 22.0% | 20.6% | 1.3% |
| 2016 | 19.5% | 18.8% | 2.3% |
A quarter of the league’s pass plays last season had two or more tight ends on the field, the highest rate in the 2000s.
Five teams ran 100-plus plays with three or more tight ends on the field, and another (Chicago) was at 99.
The Rams ran an NFL-record 331 plays in 3TE sets.
The next closest team (the Steelers) was at 145.
The Rams averaged 8.4 yards per pass play with three or more tight ends on the field.
The league average was 6.3 yards.
Offenses were able to do more in the passing game in heavier sets because defenses came out of their sub-packages more often, as noted above.
Rates of Snaps With 5+DBs on the Field vs. Multiple TE Looks
| Year | 2+TEs | 3TE |
|---|---|---|
| 2025 | 32.2% | 36.0% |
| 2024 | 40.0% | 44.0% |
| 2023 | 44.3% | 48.7% |
| 2022 | 37.9% | 41.2% |
| 2021 | 40.5% | 43.6% |
| 2020 | 36.6% | 40.3% |
| 2019 | 31.7% | 34.7% |
| 2018 | 27.7% | 30.9% |
| 2017 | 16.5% | 19.0% |
| 2016 | 21.5% | 23.1% |
We already highlighted that fewer wide receivers and defensive backs were on the field last season, but there was a large shift compared to 2024 in how often defenses played in base personnel.
Last season saw roughly an 8% drop in sub packages against 2TE sets, and that same decline against 3TE sets.
Multiple TE Sets vs. Base and Sub Defenses in 2025
| Defense | Y/A | Pass Success | YPC | Run Success |
|---|---|---|---|---|
| Sub | 6.9 | 44.5% | 4.5 | 41.8% |
| Base | 7.3 | 50.4% | 3.6 | 39.6% |
In 2024, when offenses found some footing, defenses allowed 4.6 yards per carry to running backs in sub packages against 2TEs, compared to 3.8 YPC in base.
This played a role in the continued spike in the cat-and-mouse game of personnel.
This is the best counterpunch NFL offenses have found in the current meta because it puts defenses in a bind.
NFL defenses have placed such an emphasis on defending the pass out of the explosive 3WR, spread-offense spike that offenses have started to exploit it by creating explosive passing plays out of these heavy sets.
This is how offenses are attempting to have their cake and eat it too.
You also have to be able to stop the running game out of sub-packages, which is no easy feat for everyone.
NFL coaches do not want to get run on, even if a successful run is less valuable than a successful pass.
If they did not care about the run, we would not be seeing the base defense spike rise so much under the current umbrella of teams running more and going heavier.
If you can’t stop the run in sub-packages, you are forced to match personnel with the offense, which can create matchup advantages in the passing game if the offense has viable two-way options at tight end.
The fullback position has diminished in the current era because players lack strong passing acumen when offenses need to throw.
That has more to do with the evolution of tight ends than with fullbacks themselves, but your traditional 21 personnel is too restrictive.
If you are playing 21, then not only do you have a fullback on the field, but it also forces your tight end to be a two-way player who can make an impact in line and as a route-runner when moved into the slot.
There is just a finite number of those guys, which is why we have pairings like Dawson Knox and Dalton Kincaid.
There is also some irony here with Sean McVay blowing the doors open on this.
When McVay became a head coach, he pivoted away from the fullback in the Kyle Shanahan-style offense in favor of 11 personnel.
He ran 11 personnel more to run out of it, using players such as Robert Woods, Cooper Kupp, and Puka Nacua as movement players that could play in the run game.
But defenses could not overcommit to the run because those players offered a wealth of value to win as pass catchers as well.
Now, McVay flipped the script and played heavier sets to create leverage, throwing the ball against base defenses.
Only five defenses played five or more defensive backs against multiple tight end sets on half of their snaps against those looks: Seattle (79%), Baltimore (68.3%), Chicago (63.4%), San Francisco (54.1%), and Buffalo (50.8%).
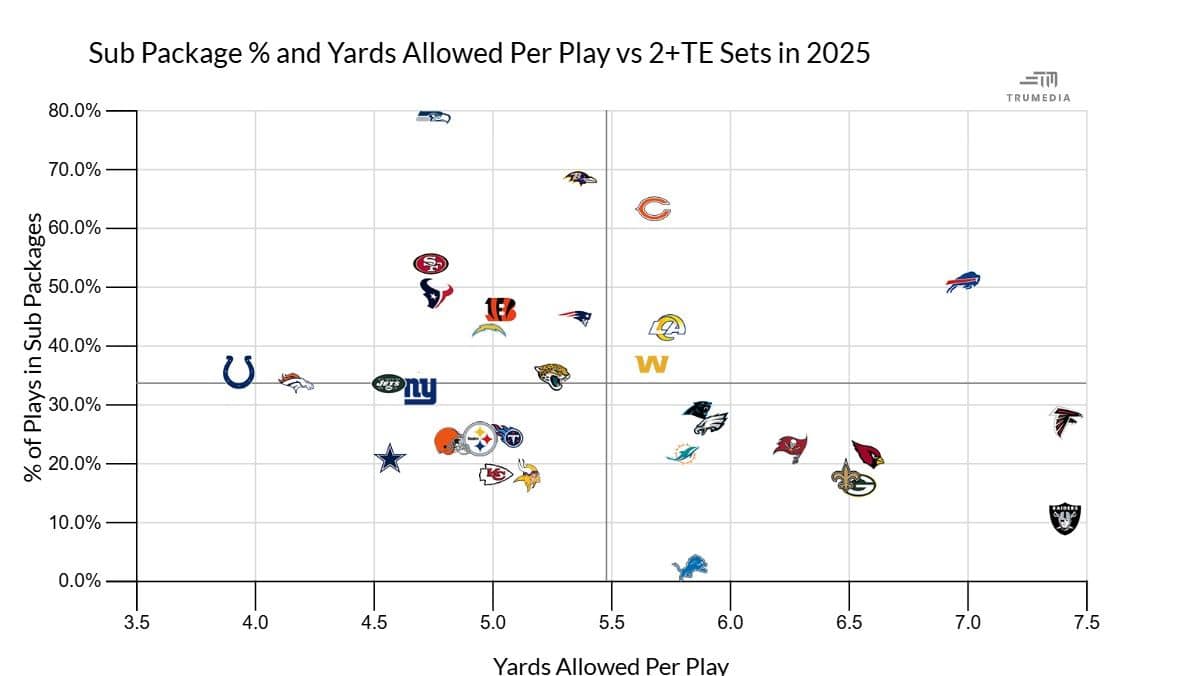
Seattle showed that you do not have to play their game, but they also have an incredible top-down defense that not every team can replicate.
Also, seeing Seattle and Baltimore at the top with versatile players like Kyle Hamilton and Nick Emmanwori makes sense.
Seattle allowed only 3.5 yards per rush in sub packages.
The league rate was 4.5 YPC in that environment.
When Seattle did match heavy sets with base personnel, they allowed a league-low 2.4 yards per rush.
Not everyone can play that way.
The Bears played sub-packages against multiple tight-end sets at the third-highest rate and got smoked on those plays.
Chicago played sub packages on 58.8% of opponents' runs out of multiple tight-end sets and allowed 5.4 yards per rush on those plays.
The Bills were even worse, allowing 7.8 yards per rush on multiple TE runs out of sub packages.
These are not overly small sample sizes since that was by design.
Chicago faced 110 of those runs while the Bills faced 81.
Good offenses and defenses will still be dictated by their top-down personnel. Scheme and deployment can only make up for so much on the margins and create so much in isolation.
It is easy for us to sit back and say that all NFL defenses need to do is sacrifice rushing efficiency to prevent offenses from approaching things this way, but it is more of a case-by-case basis, and not everyone needs to.
Some NFL offenses will cut off their own noses trying to copy this too greatly, since you still need viable pass-catching tight ends who can win as route runners to have high-end success here, which not everyone has.
Even a team like the Steelers last year is an example of why defenses should not get overly caught up in stopping a single element of the current game.
And Pittsburgh had viable tight ends.
The Steelers averaged 6.9 yards per pass play with 0-1 tight ends on the field last year (6th in the league), compared to 4.7 yards per play in multiple-tight-end sets (last in the league).
The 49ers posted 5.8 Y/A on pass attempts in multiple-tight-end looks (29th) compared to 7.1 Y/A (3rd) without them, because their backup tight ends are not good enough pass catchers.
What These NFL Offensive Trends Mean for 2026 Fantasy Football
This was more of a foundation-setter, and we are going to go deeper into each position this week, building on these opening thoughts and applying them to running backs, wide receivers, and tight ends.
Just a few notes about where we are with all of this heading into the 2026 season.
I would love to zig while gamers are zagging and go against the grain, since gamers have caught up to what we have been building around over the past two seasons.
The problem with that, though, is that the NFL is sending a strong signal that it will continue to swerve toward this approach until it is pushed as far as it will go, just as we previously saw with the 11-personnel, spread-offense boom.
Not every team should go heavier, and some will do so to their detriment just by pursuing league-wide trends.
There will certainly be a bubble that pops here, just as in all prior NFL cycles, but 2026 does not appear to mark a shift in the league's direction.
Even if there is systemic failure and defensive calibration, the league is telling us it wants to keep going down this road in the immediate future.
At the NFL Combine, the league invited a record 27 tight ends.
22 tight ends were drafted this spring, up from 15 in 2025 and 12 in 2024.
It was the most tight ends selected in a draft since 2002.
Going across the head coach and offensive coordinator hires this offseason, we had another handful of McVay/Shanahan coaching tree additions.
Nearly half of the league is from that tree.
Teams like the Ravens, Eagles, and Commanders are going to follow the trend of getting their mobile quarterbacks under center more often.
I believe that the ultimate goal for teams will being capable of adjusting from a week-to-week basis and having the ability to come in and out of these heavy sets versus 11 personnel.