
At Sports Info Solutions (SIS), we extensively chart every play of every NFL game, including who is on the field, where each player is lined up, and what assignment they performed. Using this data allows us to create advanced statistics and perform innovative research such as seeing how backup cornerbacks perform. It also allows us to perform relatively simple analysis that, within the right context, can provide meaningful results.
With that in mind, we analyzed how teams in 2018 performed with and without each player on the field to create individual Plus/Minus values that can be broken down by multiple splits. This is not a novel idea, as forms of Plus/Minus exist in other sports, but by combining our charting data with metrics like Expected Points Added (EPA) and context information like personnel and play type, we can see which players added value to their teams in different situations.
EPA was the metric chosen to evaluate how teams performed since it controls for context variables such as down, distance, and field position. Plays were split between designed pass plays (includes scrambles and backward passes and excludes spikes) and designed run plays (includes jet sweep passes and excludes kneel-downs) to get an understanding of how each player performs in the two facets of offense. Plays were also split by loosely defined “Spread” personnel (3+ wide receivers on the field) and “Heavy” personnel (2 or fewer wide receivers on the field).
Overall Leaders by Position
Before we get into which players are adding the most value in different splits, let's first look at the leaders of each respective position without any split applied to get a baseline of how players help teams perform overall:
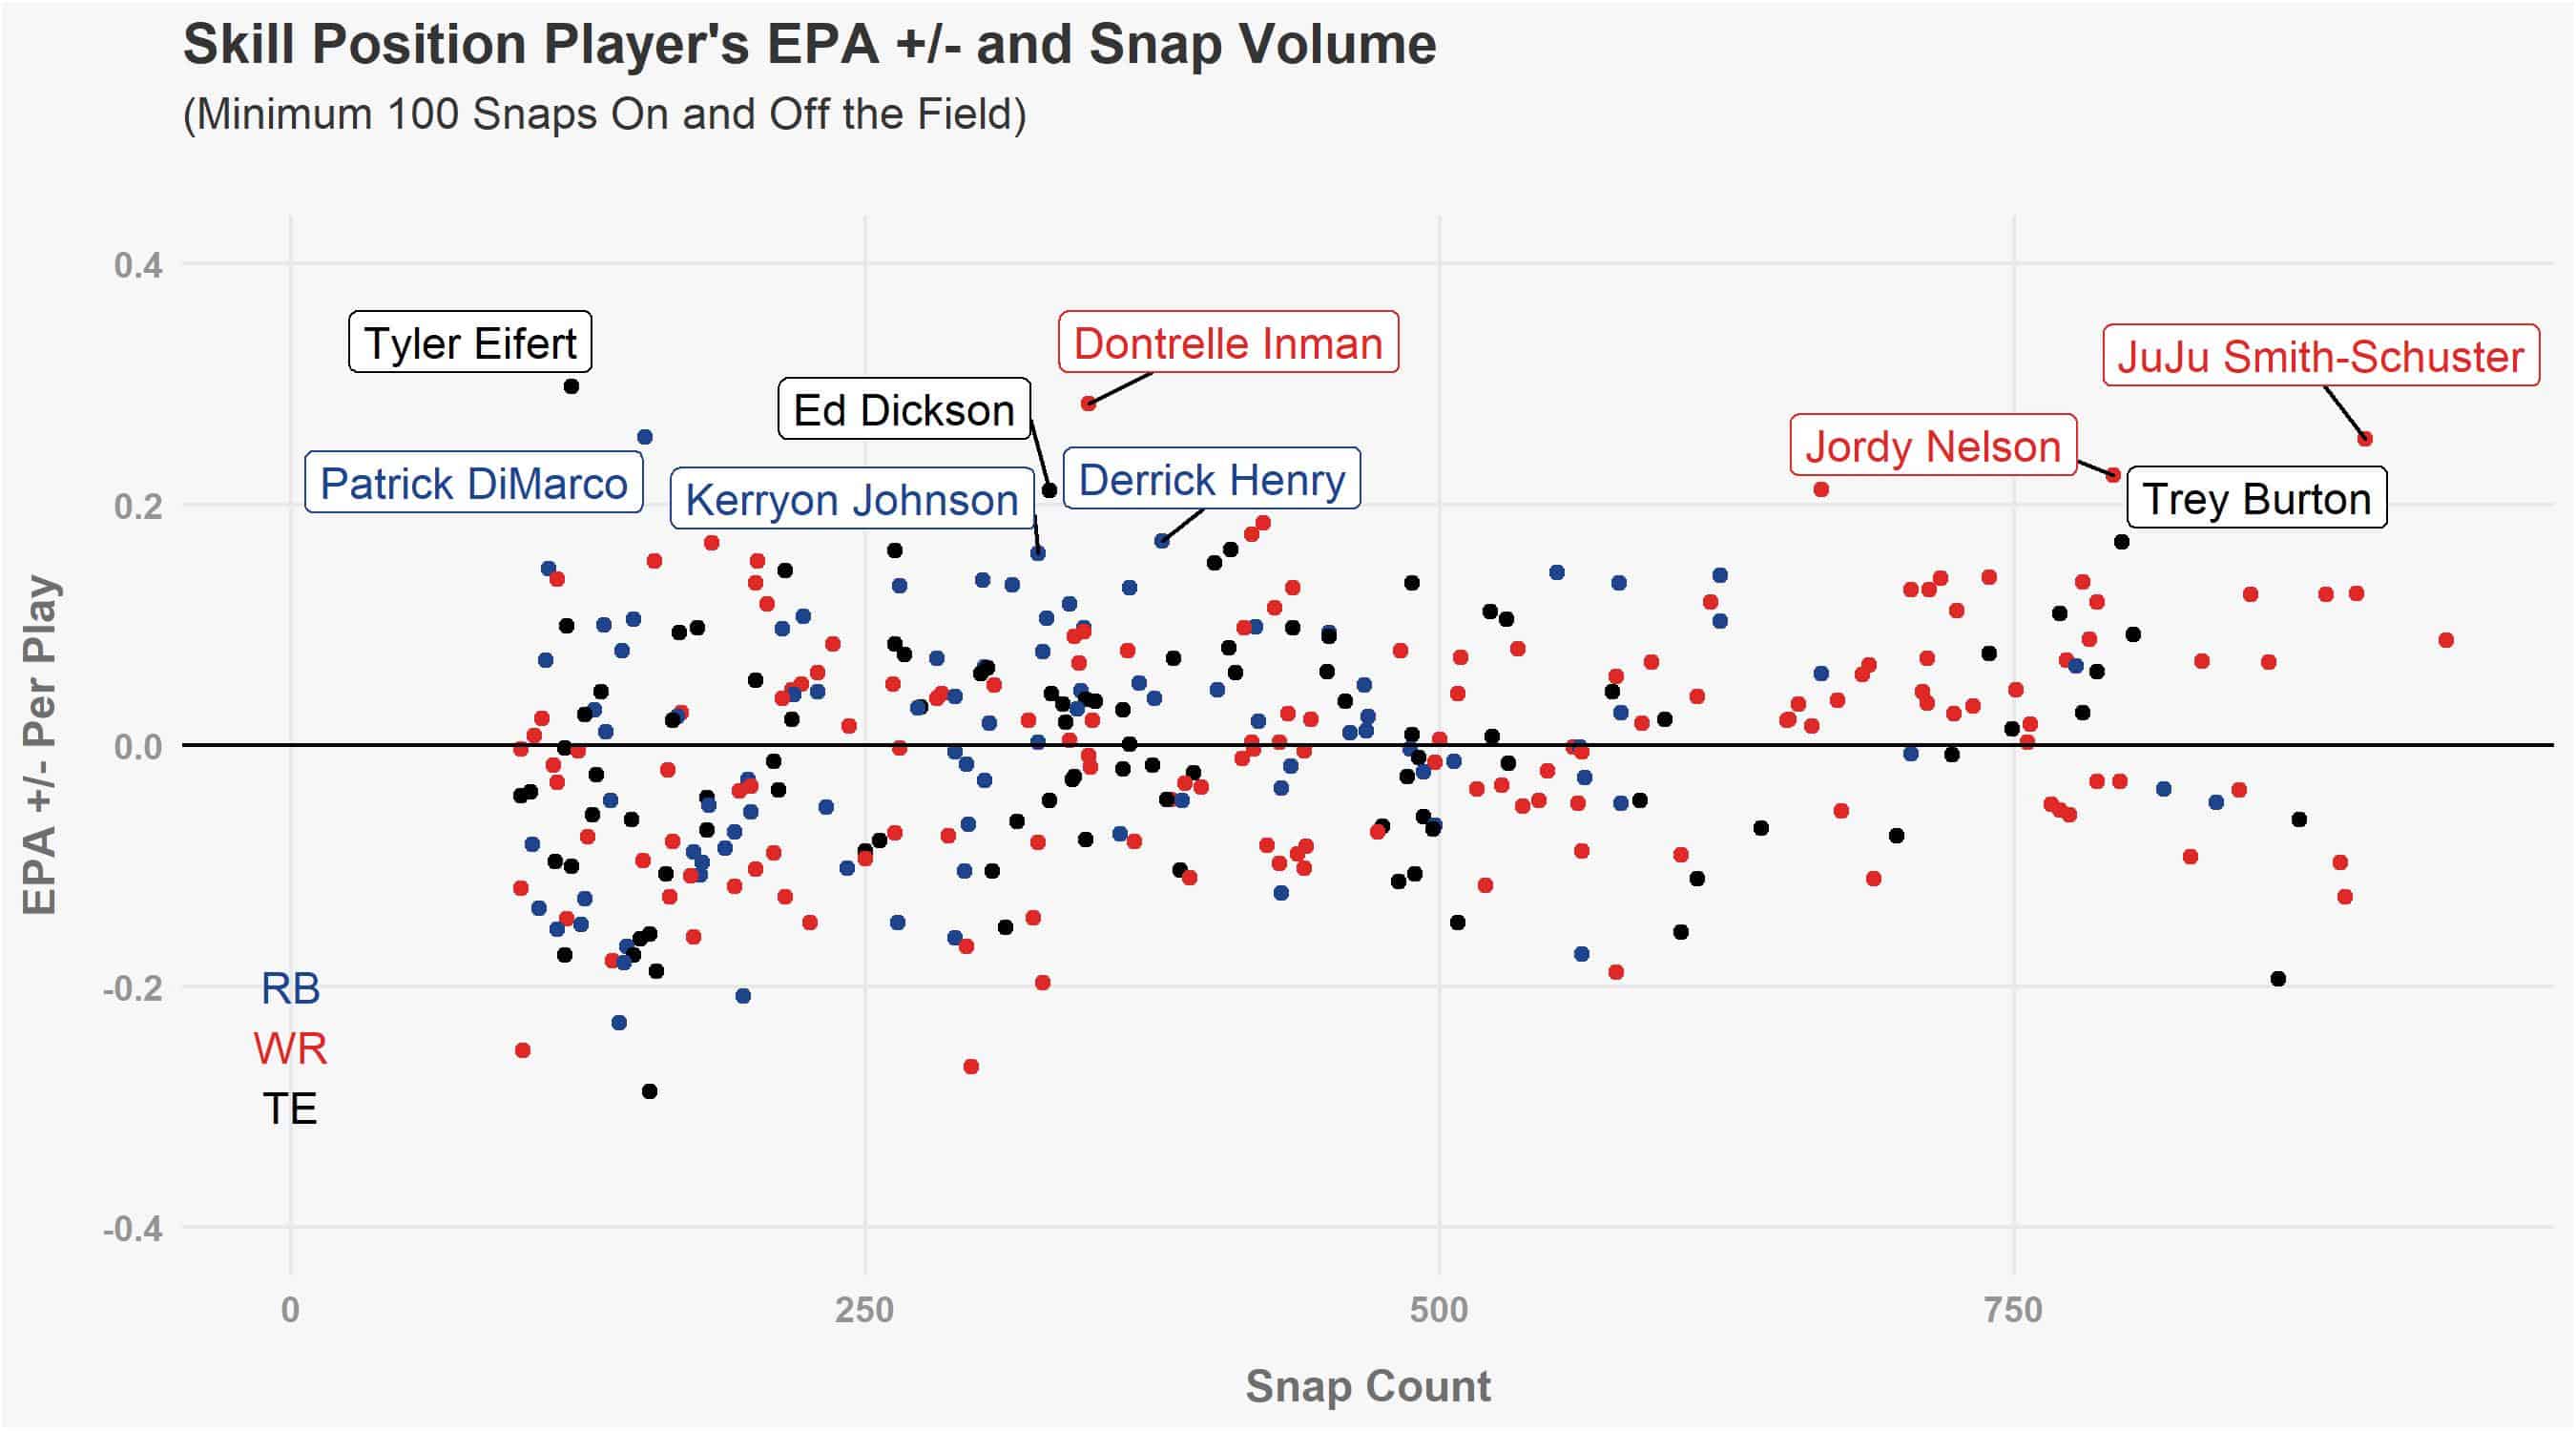
The first thing that jumps out from the graph above is just how much better certain teams’ offenses were with specific players on the field. The leaders in this metric saw their teams offensive success increase with them on the field by over 0.20 EPA Per Play, with Bengals tight end Tyler Eifert leading all position players with a plus-0.30 EPA +/-. Eifert’s unfortunate injury history has affected his total value in recent seasons, but when healthy he provides quite a spark to the Bengals offense. Other interesting notes here include:
- JuJu Smith-Schuster’s high usage and high EPA +/- bodes well for the Steelers after trading Antonio Brown.
- The Bills offense was much better last season with fullback Patrick DiMarco on the field. This could shift this season as quarterback Josh Allen gets more comfortable and improves, as the Bills averaged an abysmal EPA of minus-0.21 without DiMarco mostly due to a struggling quarterback.
- New England Patriots (and former Indianapolis Colts) wide receiver Dontrelle Inman could be an under-the-radar free agent signing. He was the highest-ranked wide receiver in EPA +/- at plus-0.27.
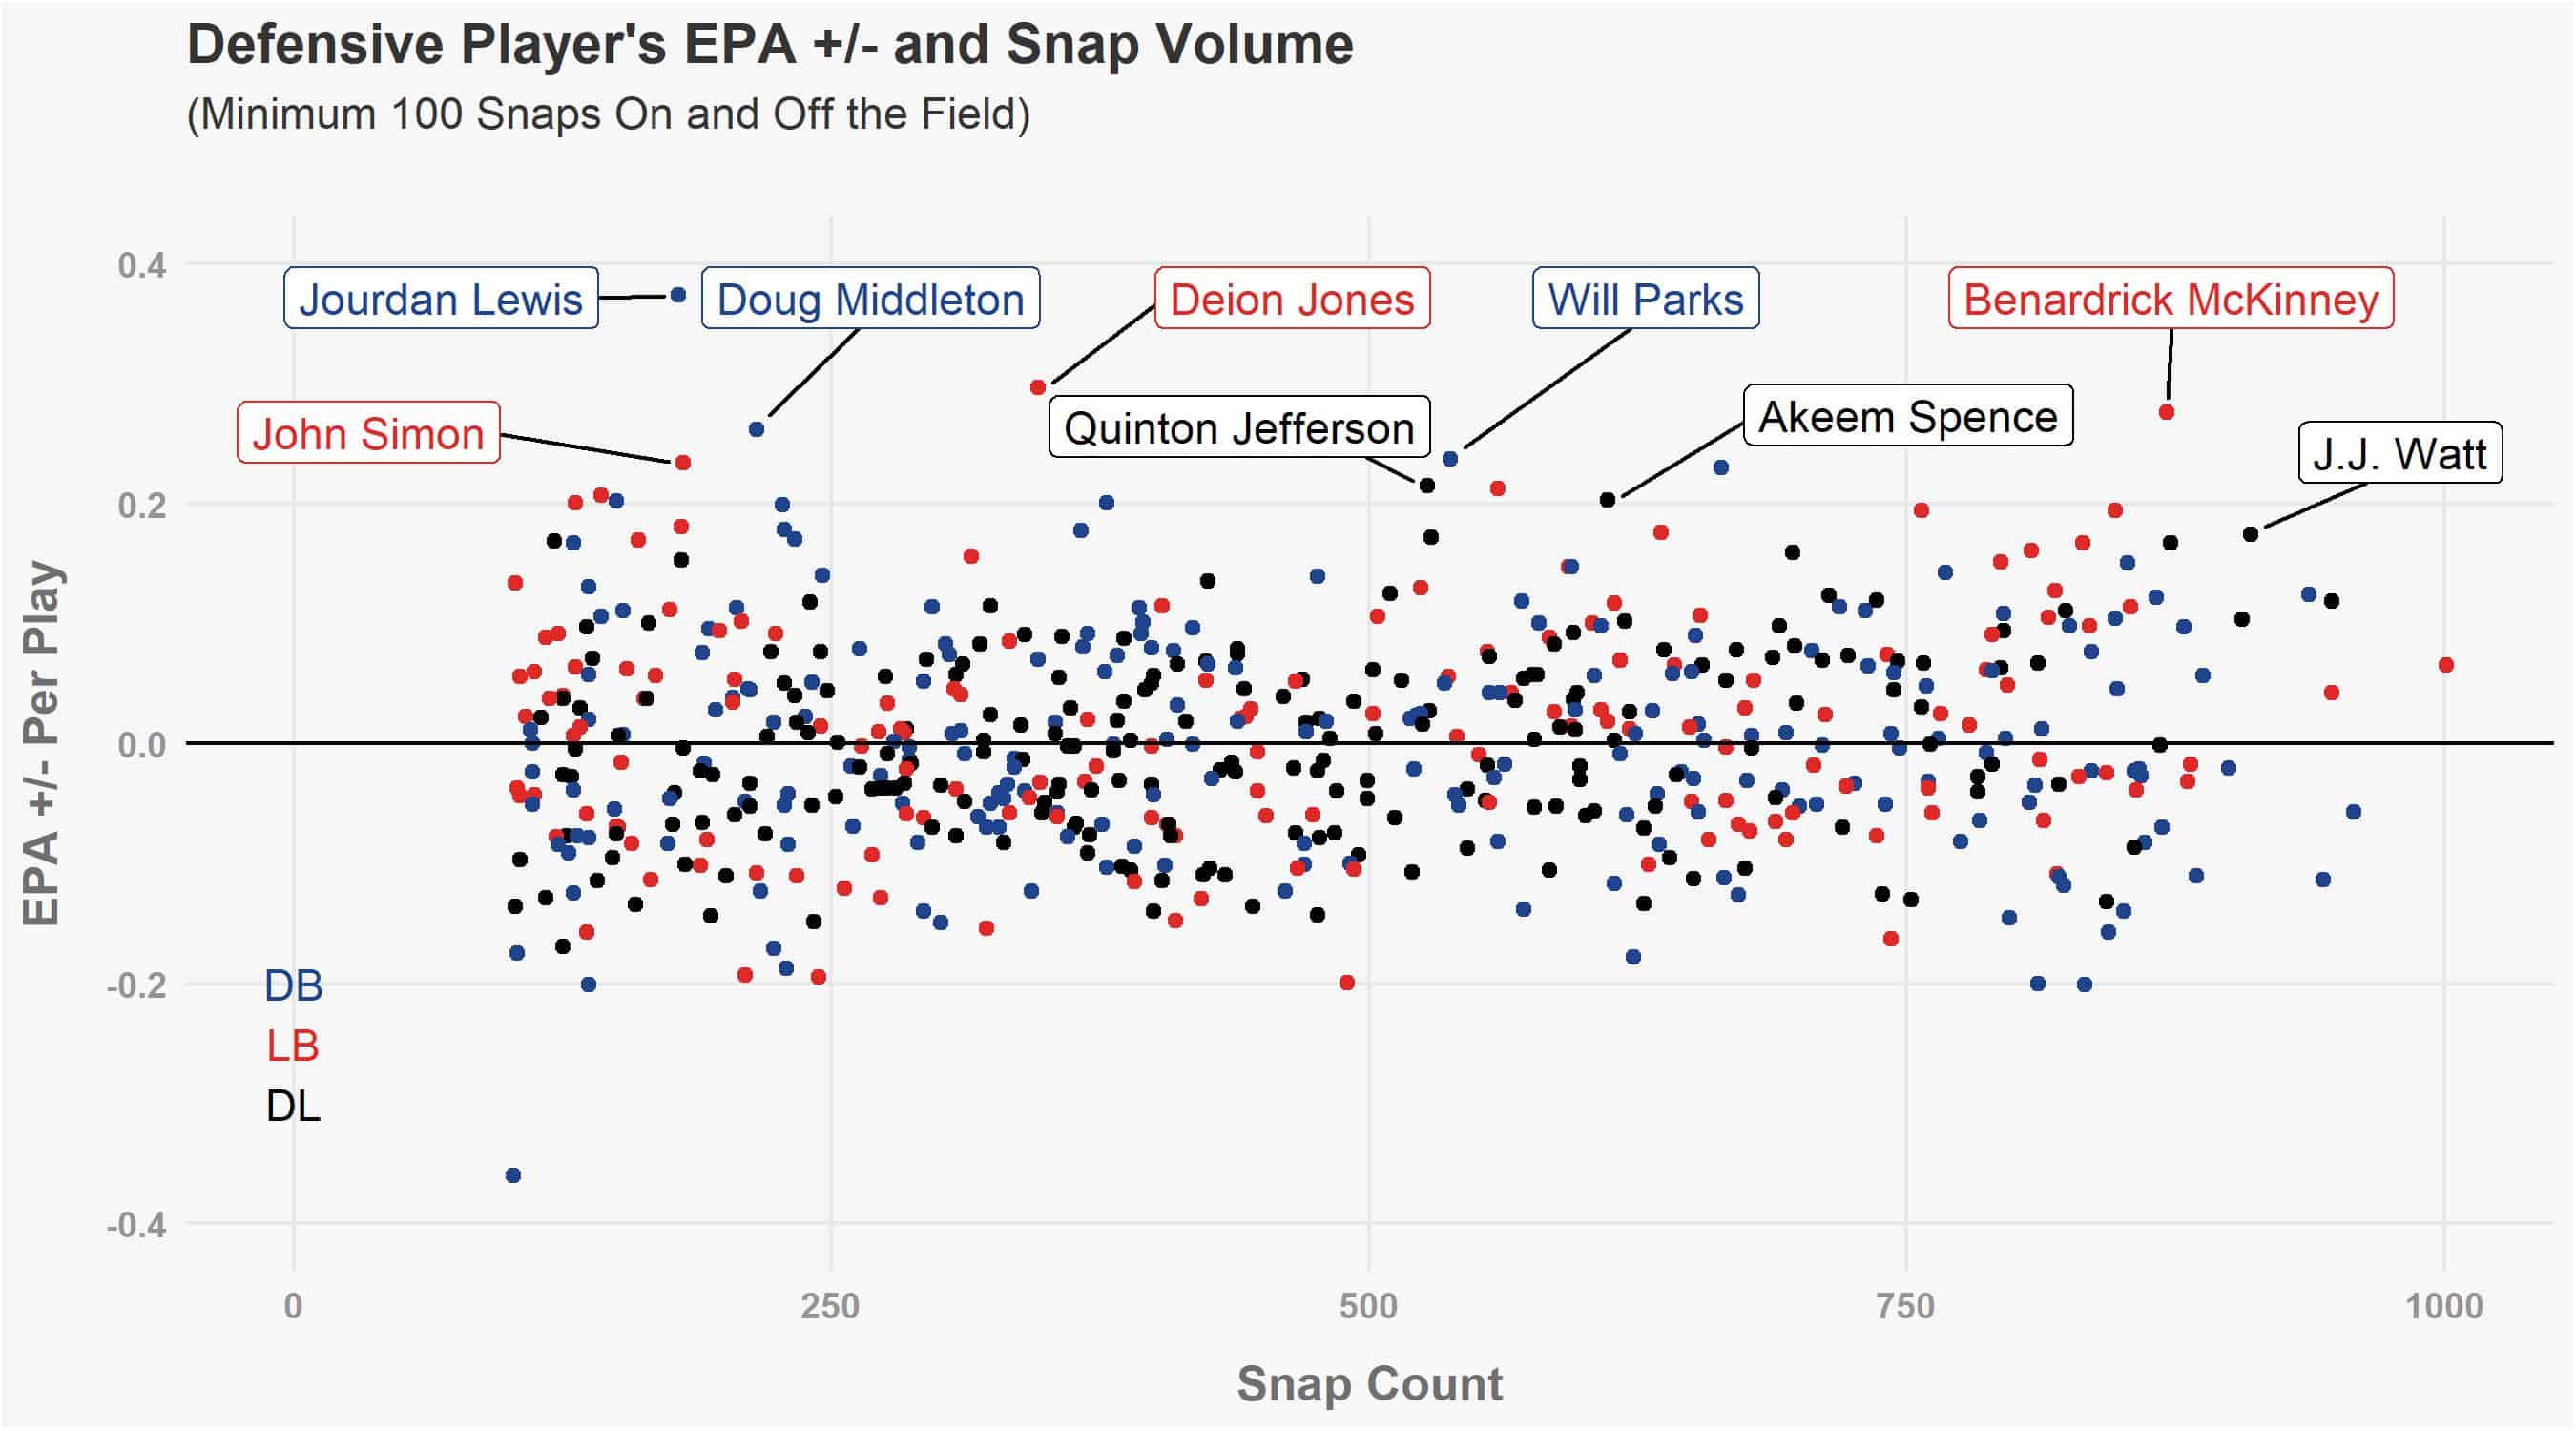
*Defensive EPA is on the same scale as Offensive EPA for this metric. Meaning that a positive EPA +/- value is good and a negative EPA +/- is bad.
Similar to the offensive skill positions, the defensive leaders in EPA +/- also saw their teams’ success increase with them on the field by over 0.20 EPA Per Play, with the overall leader being Cowboys defensive back Jourdon Lewis at +0.37. Similar to the offensive side of the ball with Eifert, injuries affected the total value of players such as Falcons linebacker Deion Jones and Jets safety Doug Middleton. Other interesting notes here include:
- The two players in the top three of their position group with the highest usage are both Texans, linebacker Benardrick McKinney and defensive lineman J.J. Watt. Watt needs no explanation for why he would be a leader in a value metric such as this as he is a consistently dominant player. McKinney’s value, though, is likely tied to Watt since 89% of his snaps occurred while Watt was also on the field.
- The usage of Jourdan Lewis will be interesting to follow this season as his smaller stature doesn’t quite fit Cowboys defensive backs coach Kris Richard’s philosophy, even though he fares well in this metric.
Offensive Leaders and Trailers by Pass/Run and Personnel Groupings
Looking at the leaders in overall EPA +/- Per Play gives a good sense of which players are providing value to their team. However, it doesn’t give context into how that value is being created or what role each player is filling. To provide some context, we can now add in the play type and personnel splits mentioned earlier. By splitting EPA +/- this way, we can more accurately compare players with specific roles, such as a blocking tight end who only plays in heavier packages or a slot receiver who is only on the field in spread packages. The graphs below provide looks at players’ EPA +/- Per Play within these splits. Players above plus-0.2 on pass or run plays are highlighted blue, while players below minus-0.2 on pass or run plays are highlighted red.
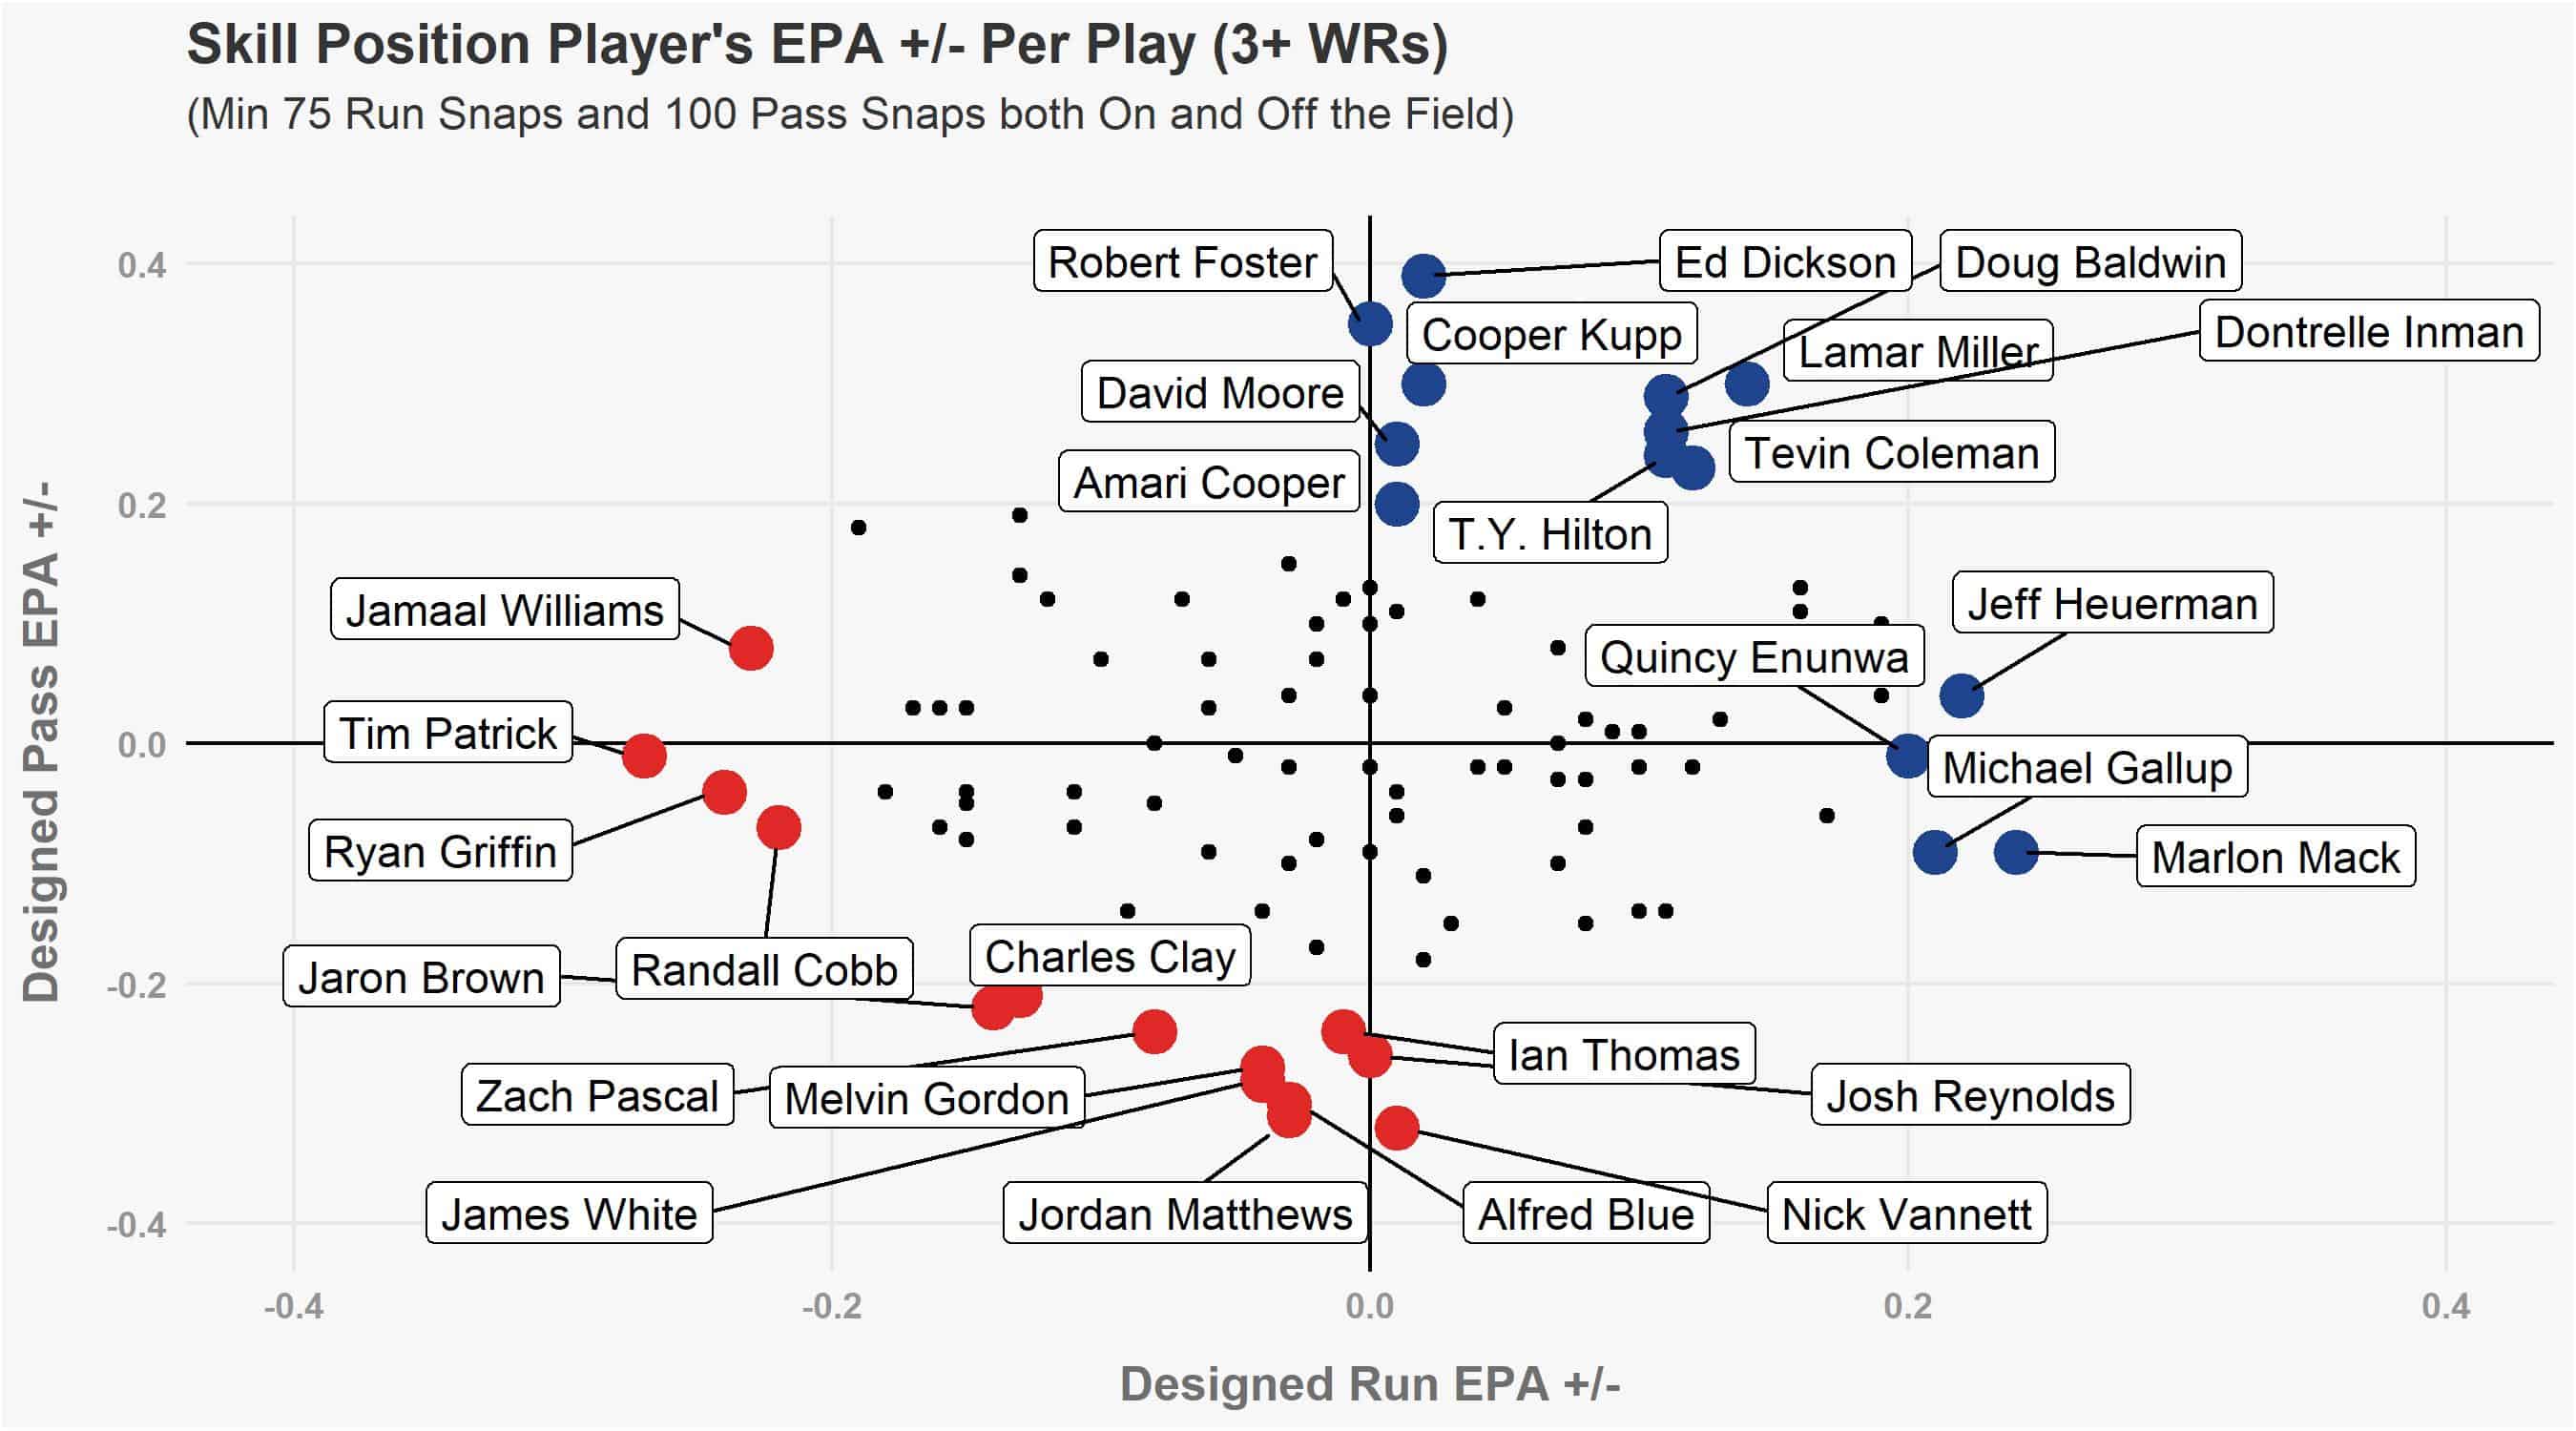
The main takeaways here:
- Dontrelle Inman continues to look good by this metric, as he is in a group of five players who saw their teams’ success significantly increase in both the passing game and running game when he was on the field. The other four players are Lamar Miller, Doug Baldwin, Tevin Coleman, and T.Y. Hilton.
- You might notice Patriots running back James White showing up as a negative in the passing game and have some questions. However, this is possibly due to his high usage in the passing game and therefore his presence on the field being a potential tell for the defense.
- Another running back who rates poorly by this metric is Melvin Gordon of the Chargers, who had an EPA +/- Per Play of minus-0.27 on his 213 designed pass snaps in this split. He also had a minus-0.04 on his 88 designed run snaps.
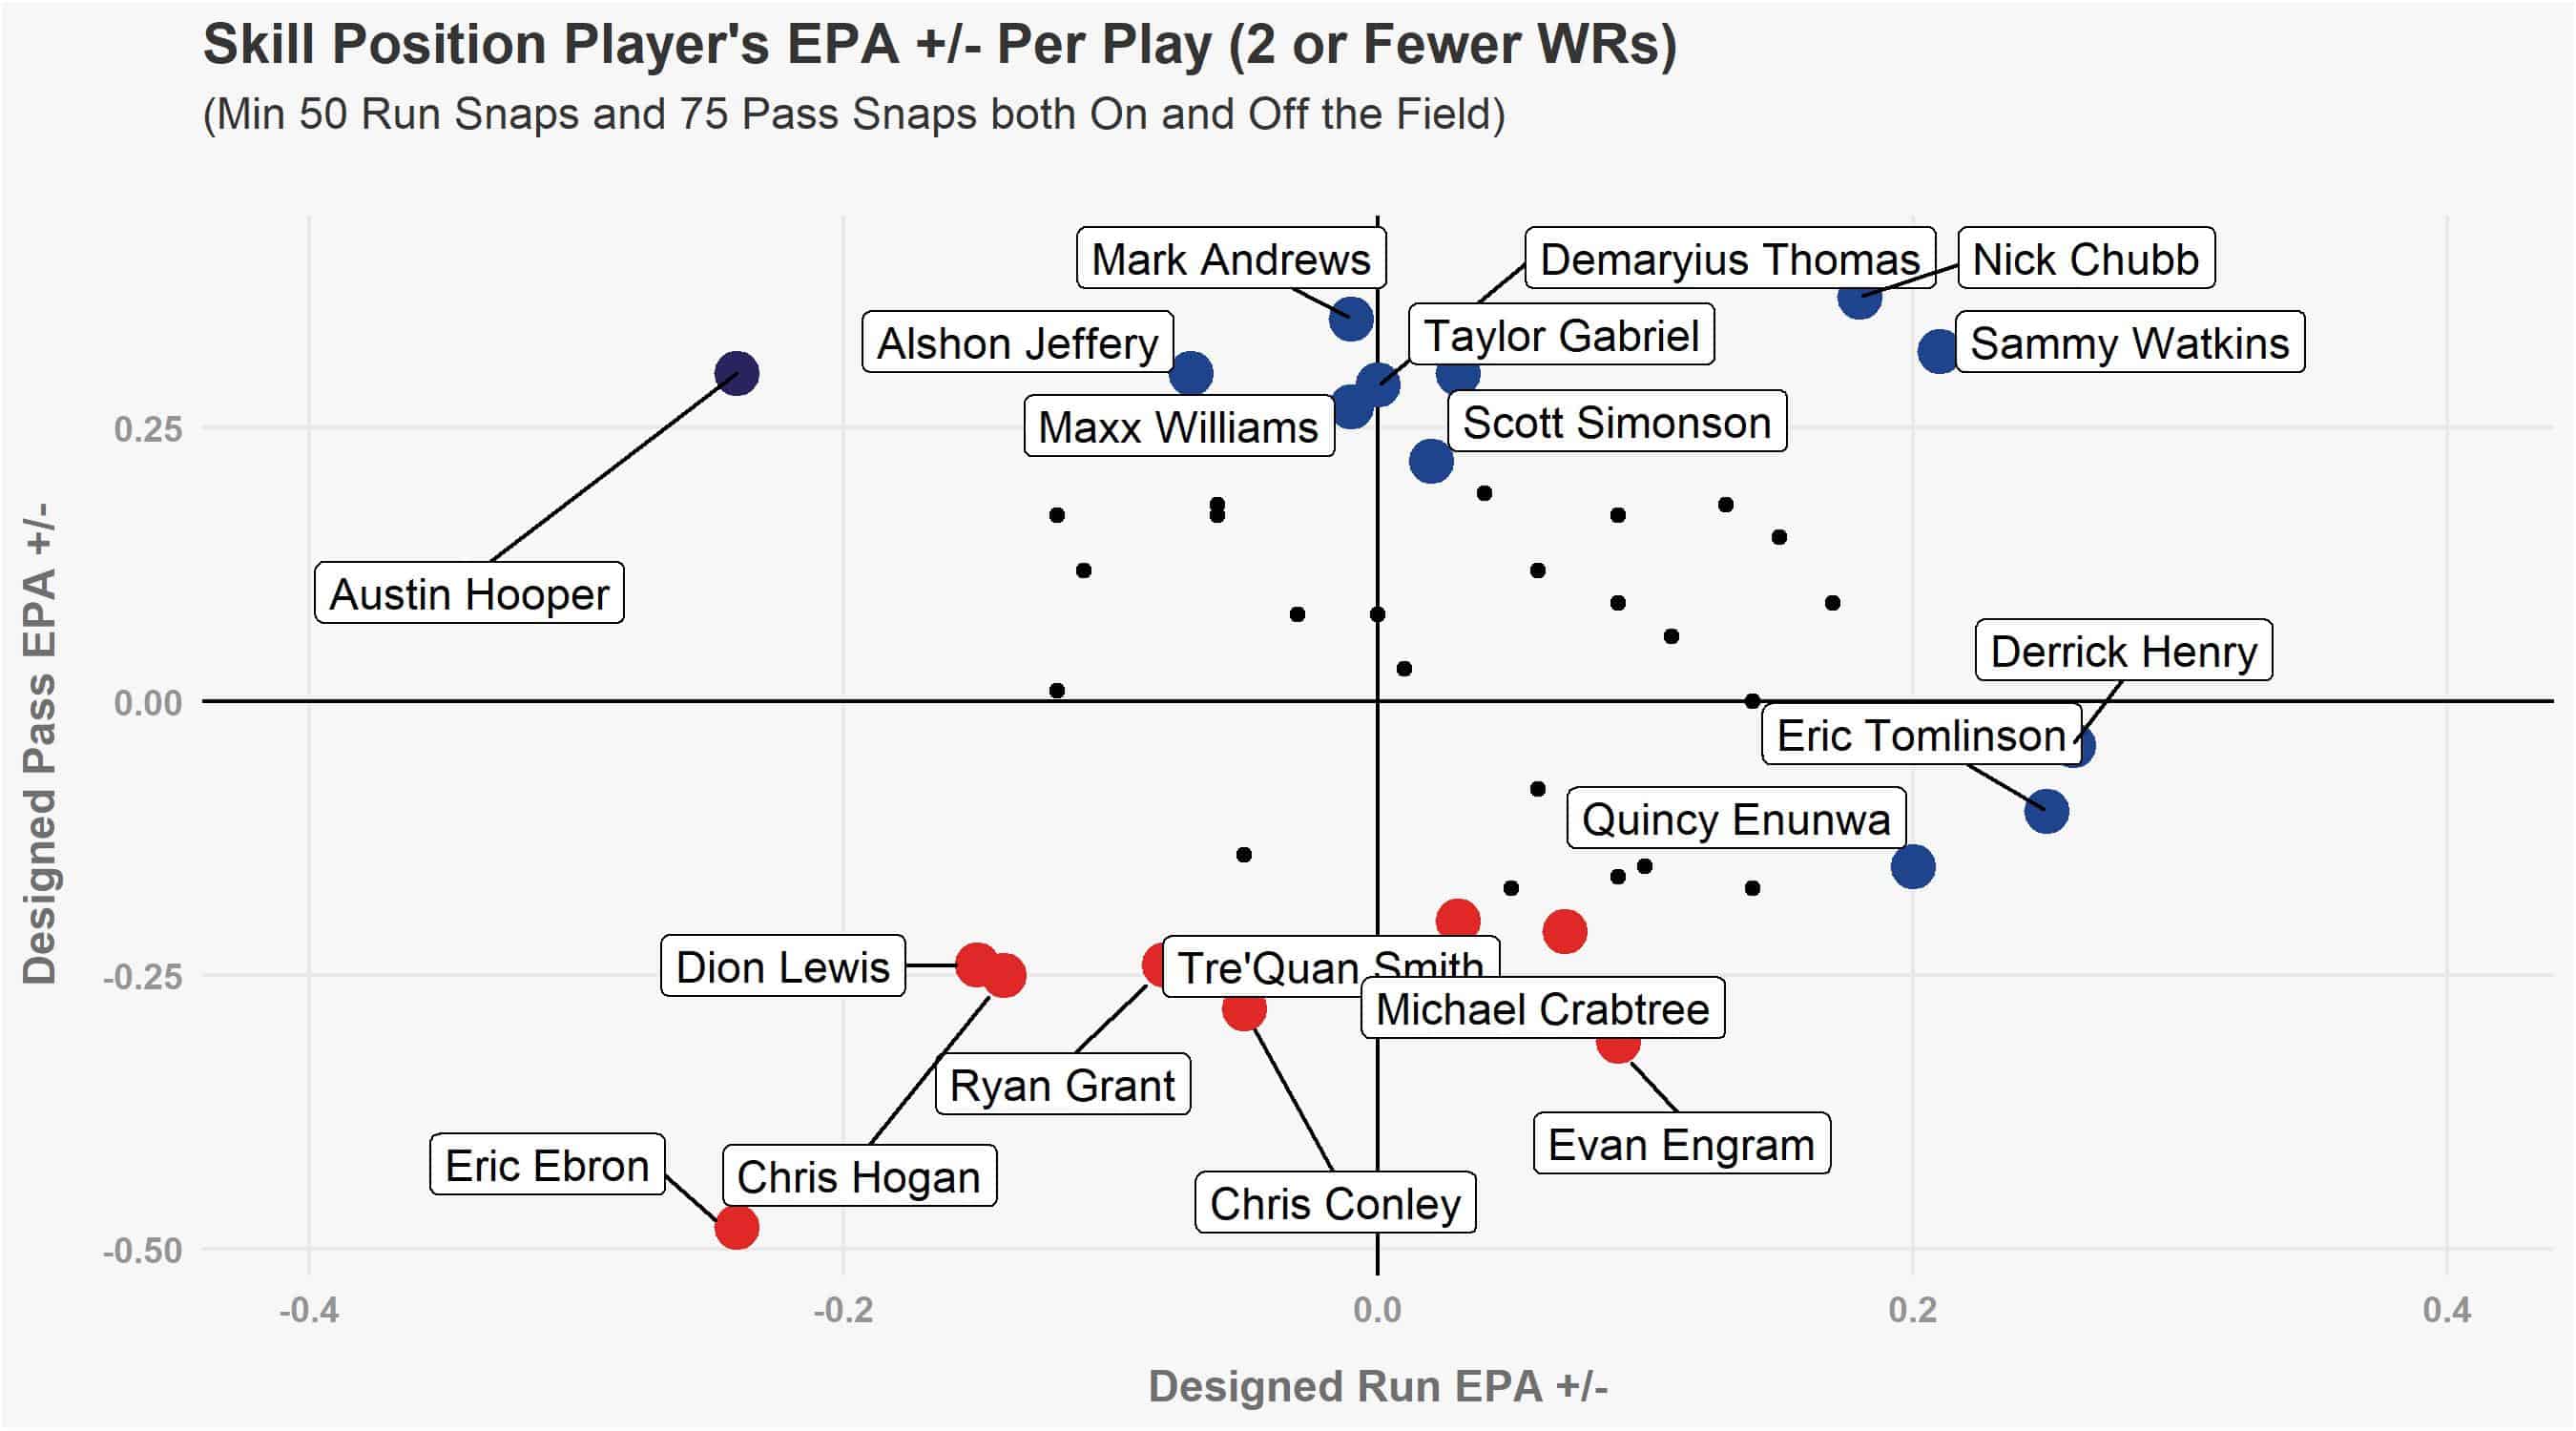
Even with the snap count minimums lowered for these “Heavy” personnel packages, there are still only a few players who meet them. That said, we can still see some interesting results and takeaways:
- The Falcons excelled more on passing plays with tight end Austin Hooper on the field. However, they also were also much worse on running plays with him on the field.
- In these “Heavy” personnel packages, the Titans were much more successful, on both pass and run plays, with a bigger back on the field (Derrick Henry) than with a smaller back (Dion Lewis).
A Practical Application
This past offseason the Texans used the Franchise Tag on Jadeveon Clowney. However, he has so far refused to report to camp and sign his franchise tender. There is now increased speculation the Texans are looking to trade Clowney. Analyzing how the Texans performed last season with and without him on the field could help shed light on how valuable he was last season.
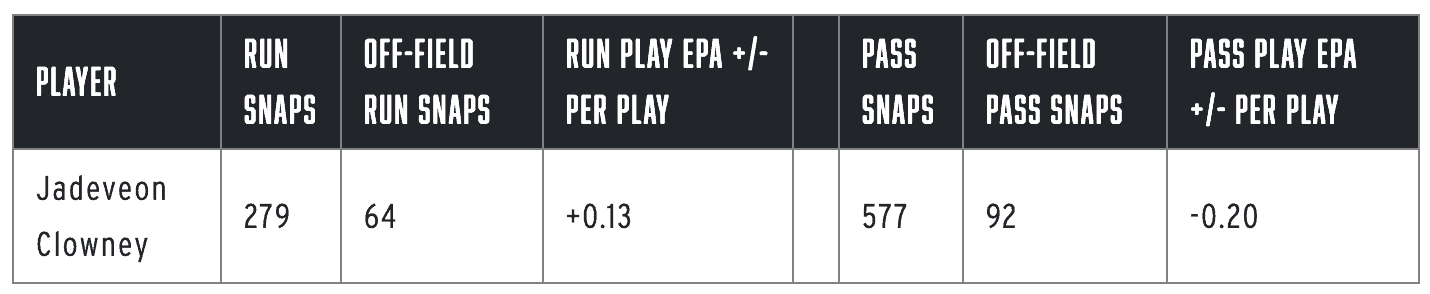
*Snap counts are for Designed Passes and Designed Runs as mentioned earlier
EPA +/- Per Play shows some interesting results when looking at how the Texans defense performed when Clowney was on and off the field. With him on the field, the Texans defense was much better against the run, as he had an EPA +/- Per Play of plus-0.13 on running plays. Though, it is odd that the Texans were significantly worse against the pass with him on the field since he is considered — and is demanding the long term contract of — a high-level pass rusher.
As mentioned earlier with Benardrick McKinney and J.J. Watt, teammate effects could be at play here, skewing Clowney’s EPA +/- Per Play. Though, in comparison, fellow pass rusher Watt saw the Texans defense drastically improve against the pass when he was on the field. He had an EPA +/- of plus-0.26 on designed pass plays.
Future Research, and Conclusion
Before we conclude, we need to mention there are a few things to watch out for when doing this type of analysis in football as compared to other sports such as hockey or basketball. In football it is not uncommon for some star players to play either every snap or close to every snap, and for backups to play relatively few snaps. This creates sample size issues for these players and is why we didn’t attempt to evaluate quarterbacks or offensive lineman using this metric. It is also why you didn’t see certain players including DeAndre Hopkins, Travis Kelce, Christian McCaffrey, Jalen Ramsey, Bobby Wagner, and others in this analysis since they almost never left the field.
Even with these concerns, this type of metric can be extremely useful in the everlasting pursuit of quantifying individual player value in football. There are many different directions that this sort of analysis can be used as a jumping off point for, but hopefully, this showed how a simple idea can help add further context to individual player values.