Even with the increased emphasis on passing in the modern NFL, designed runs still account for close to 40 percent of all offensive plays. Yet, there still has been a general lack of quantifiable metrics to evaluate individual defender performance against the run.
Tackles, forced fumbles, and only recently broken tackles make up the small list of individual run defense metrics most analysis has had to rely on. Unfortunately, this has led to an overemphasis on the simplistic total tackles metric when it comes to discussing the value defenders provide. To get a better understanding of an individual defender’s performance in the run game, let's take a look at some more advanced metrics that can be gleaned from Sports Info Solutions charting data.
All stats are for the 2019 season through Week 14
Tackles Above Expected
Total tackles (solo plus assists) is the most commonly used statistic to quantify individual run defense, and while it does provide some information, tackles without context can be quite misleading when evaluating player performance. In a very broad sense, total tackles provides us with a glimpse into which players are around the ball most often, but that is often a measure of opportunity and not always skill.
In an attempt to ascertain more information than we could from the basic total tackles stat, we turned to SIS charting data. The result is the more advanced metric for run defense, Tackles Above Expected, which uses personnel, pre-snap alignment, and intended run gap data to assign an expected tackle rate to each player on the field. We then use this tackle expectation to adjust the evaluation of each player. As an example, on a run off left tackle we’d expect more impact from the frontside defensive end than a linebacker lined up over a tight end in the opposite slot.
Leaders in Tackles Above Expected over the last few years include well-regarded run defenders from multiple positions. Linebacker Bobby Wagner led the NFL in the stat in 2016, and defensive tackle Damon Harrison snacked his way to the league lead in both 2017 and 2018. But before we get to the current leaders in Tackles Above Expected, let’s take a look at the 2019 tackle leaders, presented below, along with their Tackles Above Expected.
Run Tackles Leaders and their Tackles Above Expected, 2019
| Player | Team | Run Tackles | Tackles Above Expected |
|---|---|---|---|
| Blake Martinez | Packers | 79 | 21 |
| Zach Cunningham | Texans | 75 | 25 |
| Joe Schobert | Browns | 75 | 21 |
| Eric Kendricks | Vikings | 73 | 19 |
| Luke Kuechly | Panthers | 67 | 13 |
| Bobby Wagner | Seahawks | 67 | 20 |
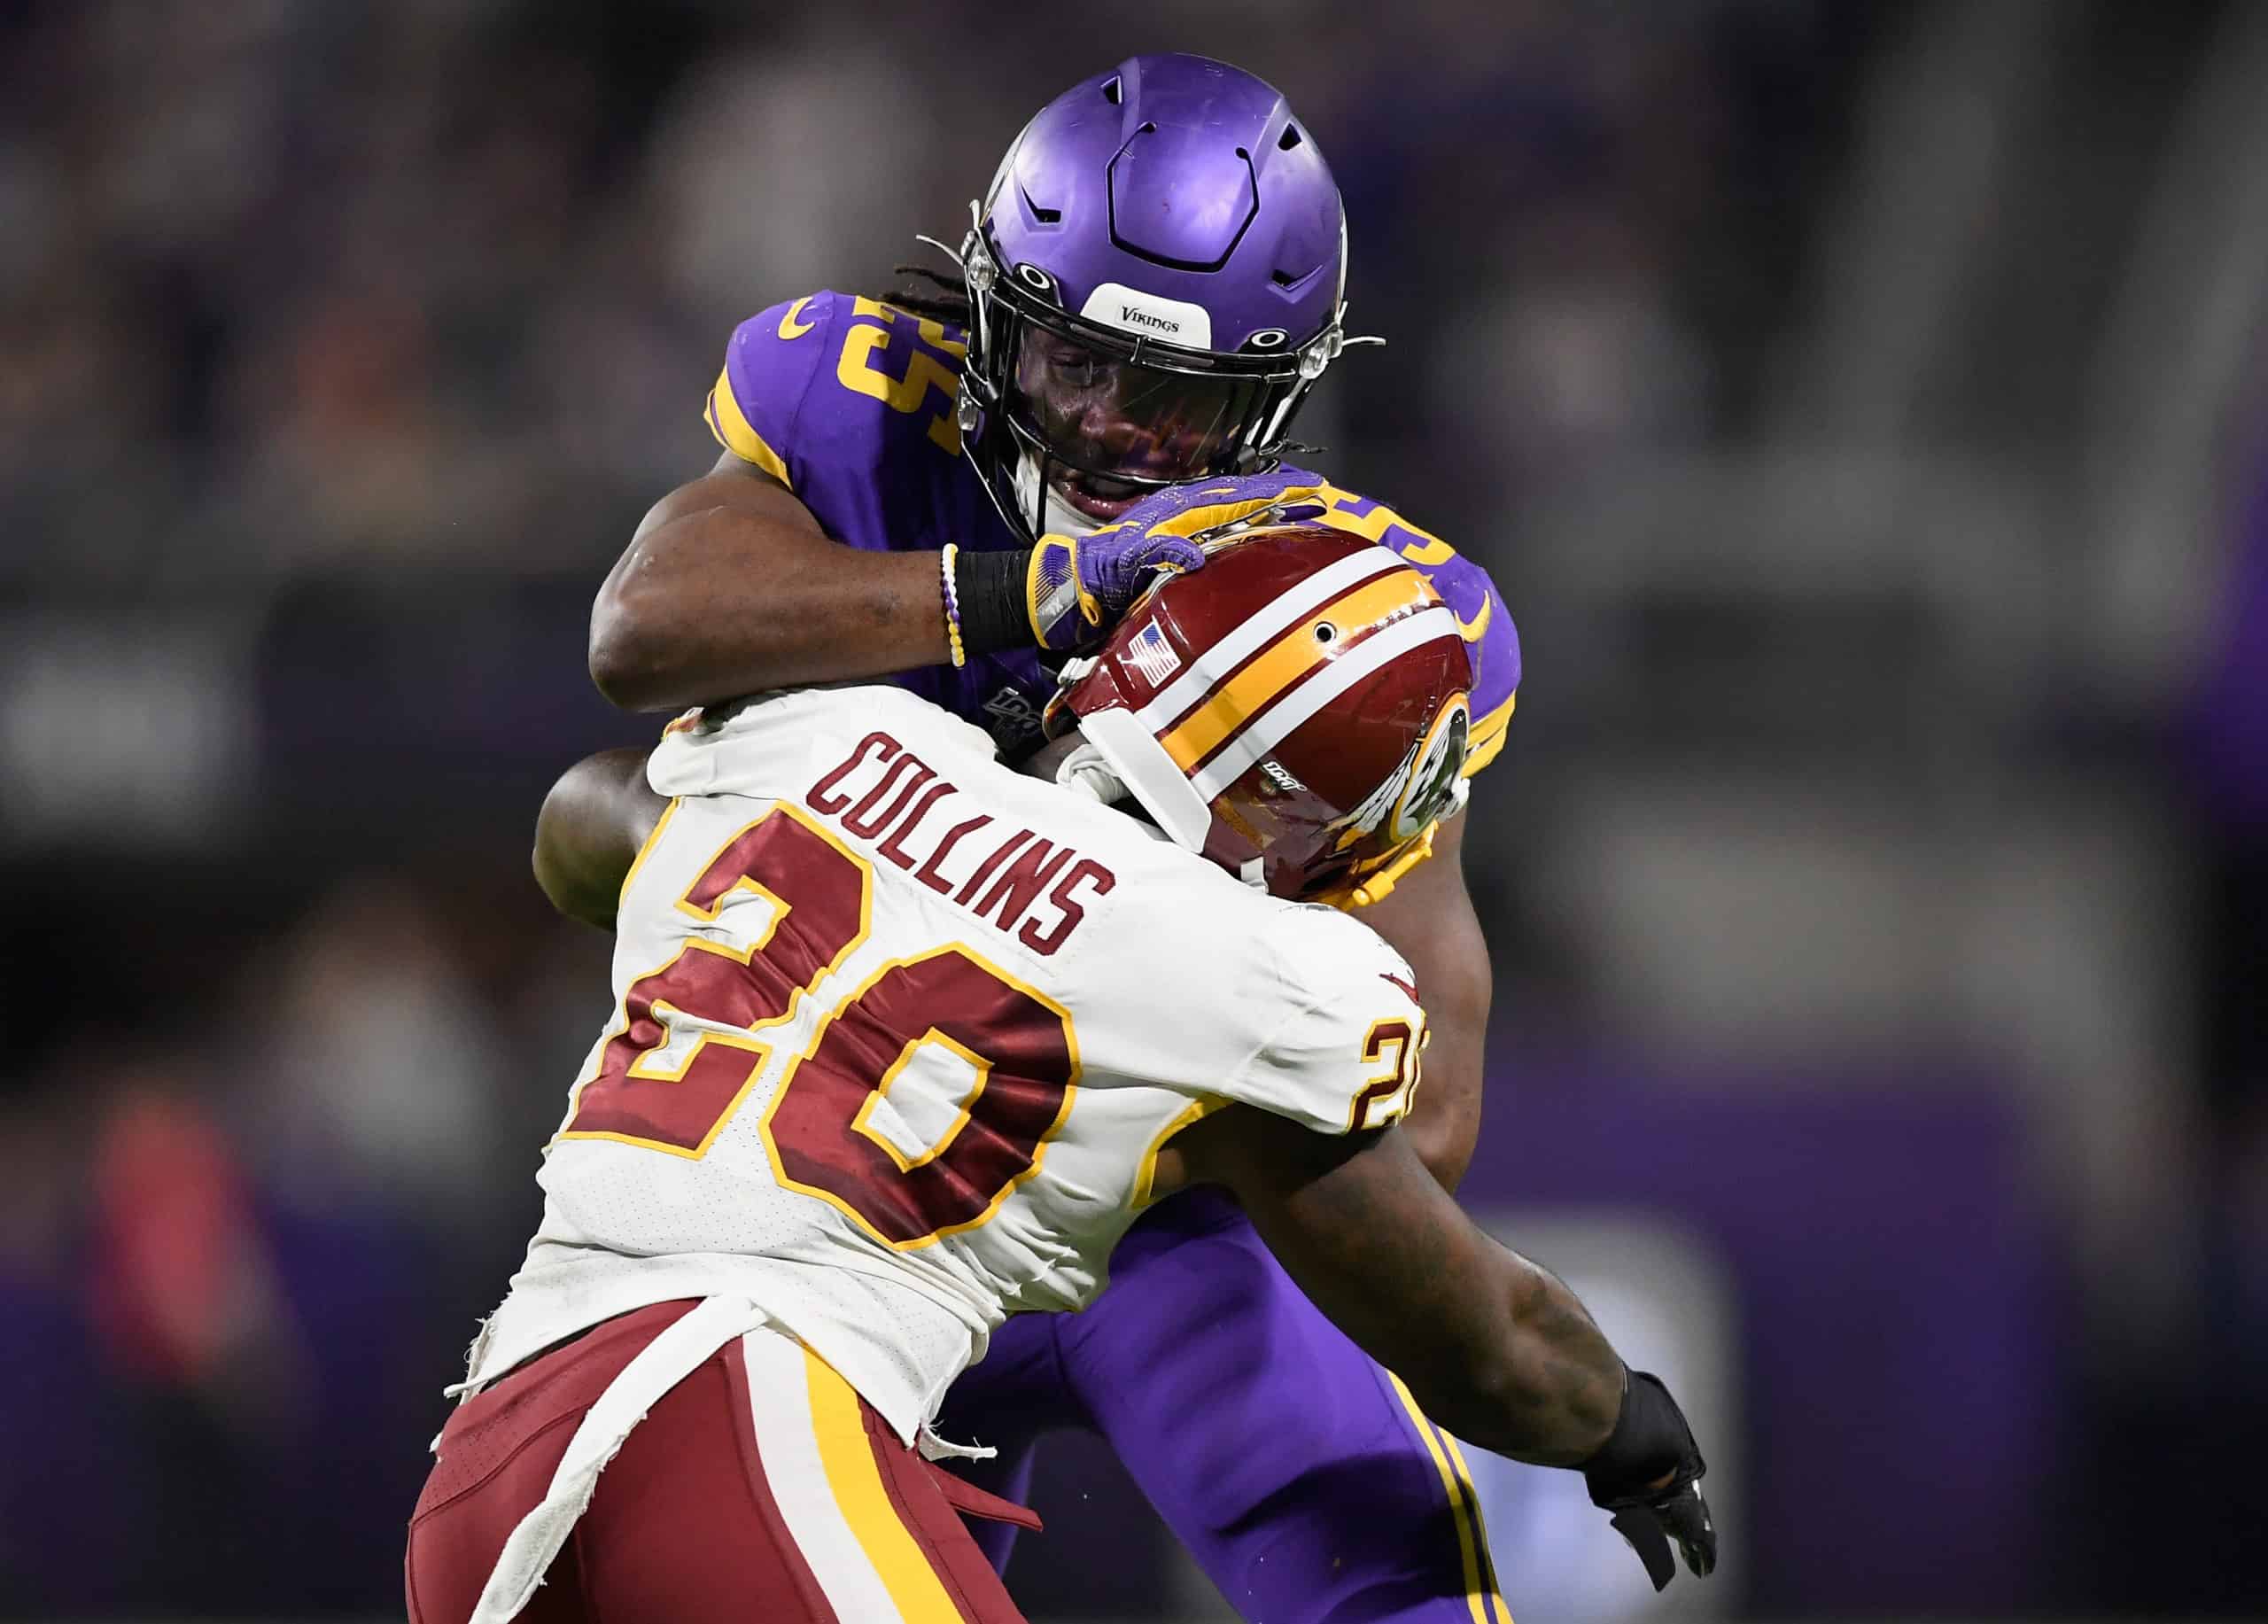
| Landon Collins | Redskins | 65 | 20 |
| Jordan Hicks | Cardinals | 64 | 5 |
| Jaylon Smith | Cowboys | 63 | 16 |
| Nick Vigil | Bengals | 60 | -2 |
| Eric Reid | Panthers | 60 | 21 |
Here we can see that most of the leaders in tackles have so far created about 20 more tackles than expected. However, we can also see that some of the leaders aren’t truly deserving of a top 10 spot. Nick Vigil of the Bengals is one such player, as he is tied for tenth in total run tackles, but by Tackles Above Expected is essentially an average player when it comes to making tackles in the run game. On the other end of the spectrum is Texans linebacker Zach Cunningham, who has made an impressive 25 Tackles Above Expected, which is tied for the league lead.
Tackles Above Expected Leaders, 2019
| Player | Position | Team | Run Tackles | Tackles Above Expected |
|---|---|---|---|---|
| Zach Cunningham | LB | Texans | 75 | 25 |
| Budda Baker | S | Cardinals | 57 | 25 |
| Grady Jarrett | DT | Falcons | 53 | 22 |
| Eric Reid | S | Panthers | 60 | 21 |
| Joe Schobert | LB | Browns | 75 | 21 |
| Blake Martinez | LB | Packers | 79 | 21 |
Tackle Depth
Making more tackles than expected based on alignment and other factors is definitely a good thing, but it also doesn't tell the whole story. This is because there is a big difference between making a great play in the backfield and getting to the ball carrier six or seven yards downfield. To get a better sense of which players are making “better” tackles we can use Adjusted Tackle Depth Plus (ATD+).
ATD+ uses the same principle as Tackles Above Expected but applies it to where on the field each tackle was made. We can estimate the average depth at which a player might make a tackle based on the personnel on the field, intended run gap, and the player’s pre-snap alignment. Based on this estimate compared to where the actual tackle was made, we can calculate ATD+, which is scaled so that 100 is average given the above factors.
As an example, Redskins safety Landon Collins’s 2019 ATD+ of 142 represents that his Average Tackle Depth is 42% better than the average player given his opportunities. This is good for fifth-best in the league among defenders with at least 30 total tackles. Below is a table of how the leaders in run tackles rate in both Average Tackle Depth and ATD+.
Run Tackles Leaders and Their ATD+, 2019
| Player | Team | Avg Tackle Depth | ATD+ |
|---|---|---|---|
| Blake Martinez | Packers | 4.1 | 89 |
| Zach Cunningham | Texans | 2.7 | 133 |
| Joe Schobert | Browns | 3.9 | 105 |
| Eric Kendricks | Vikings | 3.3 | 117 |
| Luke Kuechly | Panthers | 3.4 | 119 |
| Bobby Wagner | Seahawks | 4.8 | 87 |
By looking at ATD+ we further see why total tackles is an extremely limited stat. Packers linebacker Blake Martinez has racked up a league-leading 79 tackles on designed runs, which is 21 more than expected. However, he is making these tackles over a yard further downfield than second-place tackler Zach Cunningham and has one of the worst ATD+ among the run tackle leaders. In another comparison, Martinez is making his tackles almost a full yard further downfield than Broncos safety Kareem Jackson, who leads the league with a ridiculous 158 ATD+. The ATD+ leaderboard for defenders with at least 30 tackles is shown below.
ATD+ Leaders, 2019
| Player | Team | ATD+ |
|---|---|---|
| Kareem Jackson | Broncos | 158 |
| Samson Ebukam | Rams | 150 |
| Jamie Collins | Patriots | 146 |
| Joey Bosa | Chargers | 144 |
| Landon Collins | Redskins | 142 |
Run Defense Points Saved
After looking at Tackles Above Expected and ATD+, we can start to get a sense of which defenders rack up tackles mostly due to alignment, which defenders create more tackles than expected, and which defenders are making “better” tackles based on depth. When evaluating run defense, SIS’s Total Points system takes these types of considerations into account and adds in many others such as yards after contact, broken tackles, game situation, and more. The end result is Run Defense Points Saved, which is a single number that represents an approximation of how many points defenders have saved on designed run plays. Shown below is the run tackles leaders and their Run Defense Points Saved.
Run Tackles Leaders and Their Run Defense Points Saved, 2019
| Player | Team | Run Tackles | Run Defense Points Saved |
|---|---|---|---|
| Blake Martinez | Packers | 79 | -7 |
| Zach Cunningham | Texans | 75 | 14 |
| Joe Schobert | Browns | 75 | -1 |
| Eric Kendricks | Vikings | 73 | 13 |
| Luke Kuechly | Panthers | 67 | 5 |
In this final comparison of the leading run tacklers, we can see that simply racking up a lot of tackles does not equal value to a defense. League leader in tackles Blake Martinez has actually been a negative in the run game for the Packers. This doesn’t compare well to players behind him in Total Tackles, as he is tied for the third-worst Run Defense Points Saved in the league so far this season. Zach Cunningham, who is second in run tackles, has been much more valuable to his team as his 14 Run Defense Points Saved are tied for fifth-highest among all players. The leaders in Run Defense Points Saved are shown below.
Run Defense Points Saved Leaders, 2019
| Player | Team | Run Tackles | Run Defense Points Saved |
|---|---|---|---|
| Landon Collins | Redskins | 65 | 25 |
| Kareem Jackson | Broncos | 31 | 19 |
| Budda Baker | Cardinals | 57 | 15 |
| Tremaine Edmunds | Bills | 59 | 15 |
| Zach Cunningham | Texans | 75 | 14 |
| Dalvin Tomlinson | Giants | 34 | 14 |
| Joey Bosa | Chargers | 33 | 14 |
Final Word
Properly evaluating individual defender performance against the run is a difficult task. When compared to other facets of the game such as QB play, run defense lags behind in both useful metrics and analysis. But, by more advanced metrics such as Tackles Above Expected, Average Tackle Depth Plus, and SIS’s Total Points system we can dive deeper than simply looking at the total tackles leaderboard. This allows us to see that Landon Collins, ranked seventh in total tackles, has actually provided his team with the most value stopping the run this season. It also allows us to see that total tackles can be a mirage of value.