This is the first piece in a series of positional analysis of individual player props. Today, I’ll dig into some Quarterback player props. Unless otherwise noted, the props listed are sourced from the DraftKings Sportsbook, though it is always important to shop around to the different sportsbooks that offer these props in order to find the best odds.
Deshaun Watson over 4,000.5 passing yards
Last season, Deshaun Watson threw for 4,165 yards and 8.2 yards per attempt while playing all 16 games. He did this while facing a pass defense schedule that ranked as the sixth-most difficult by DVOA and seventh-lowest in aggregate yards per attempt allowed. This season, Watson will be facing a schedule of pass defenses that, in aggregate, rank 11th-easiest based on DVOA ratings. He is facing six teams that ranked in the bottom 10 in yards per attempt allowed last year, compared to the four he faced last season. In those four games against bottom 10 defenses, he averaged 9.7 yards per attempt, compared to 8.0 yards per attempt in the other 12 games.
Houston’s defense faced the easiest set of offenses in the NFL last year, based on DVOA. They only had to face one team that ranked in the top-10 in yards per attempt passing, the opener against the Patriots. This season, Houston will have to face six pass offenses that ranked in the top 10 in yards per attempt passing. Overall Houston’s opponents, based on win/loss percentage, was the softest in the NFL last year. This season the Texans are expected to face the most difficult schedule in the NFL. The Texans should be involved in many shootouts and inevitably close games. This should lead to an increase in Watson’s 32 pass attempts per game, which was two attempts per game behind the average NFL starting QB last year During Watson’s career, in situations where Houston was tied or trailing, his yards per attempt shoots up to 8.8, compared to 7.4 when Houston is leading.
Last season, the quarterbacks in the AFC North had the pleasure of facing the defenses of the NFC South. Ben Roethlisberger used a four-game stretch against NFC South teams to help propel him to the yardage title. In those four games he threw for 328 yards per game and a 9.2 yards per attempt average. His non-NFC South statistics were still solid at 318 yards per game and a 7.1 yards per attempt figure, but they pale in comparison. In three games against the NFC South last year as a rookie, Baker Mayfield produced 8.8 yards per attempt while he only threw for 7.4 against all other opponents. Even Andy Dalton produced a 7.9 yards per attempt against the NFC South with just 6.4 against all other opponents. Safe to say facing the NFC South is a gift from the heavens and Watson gets that honor this season.
The final variable to consider for Watson is the Will Fuller effect. In 11 games with Fuller on the field, Watson has averaged 9.0 yards per attempt, compared to only 7.7 in the 11 games with Fuller out. It will be virtually impossible to keep up with the numbers that Watson has produced when Fuller has played but it cannot be understated how impactful a deep threat like that can be to Watson’s overall numbers.
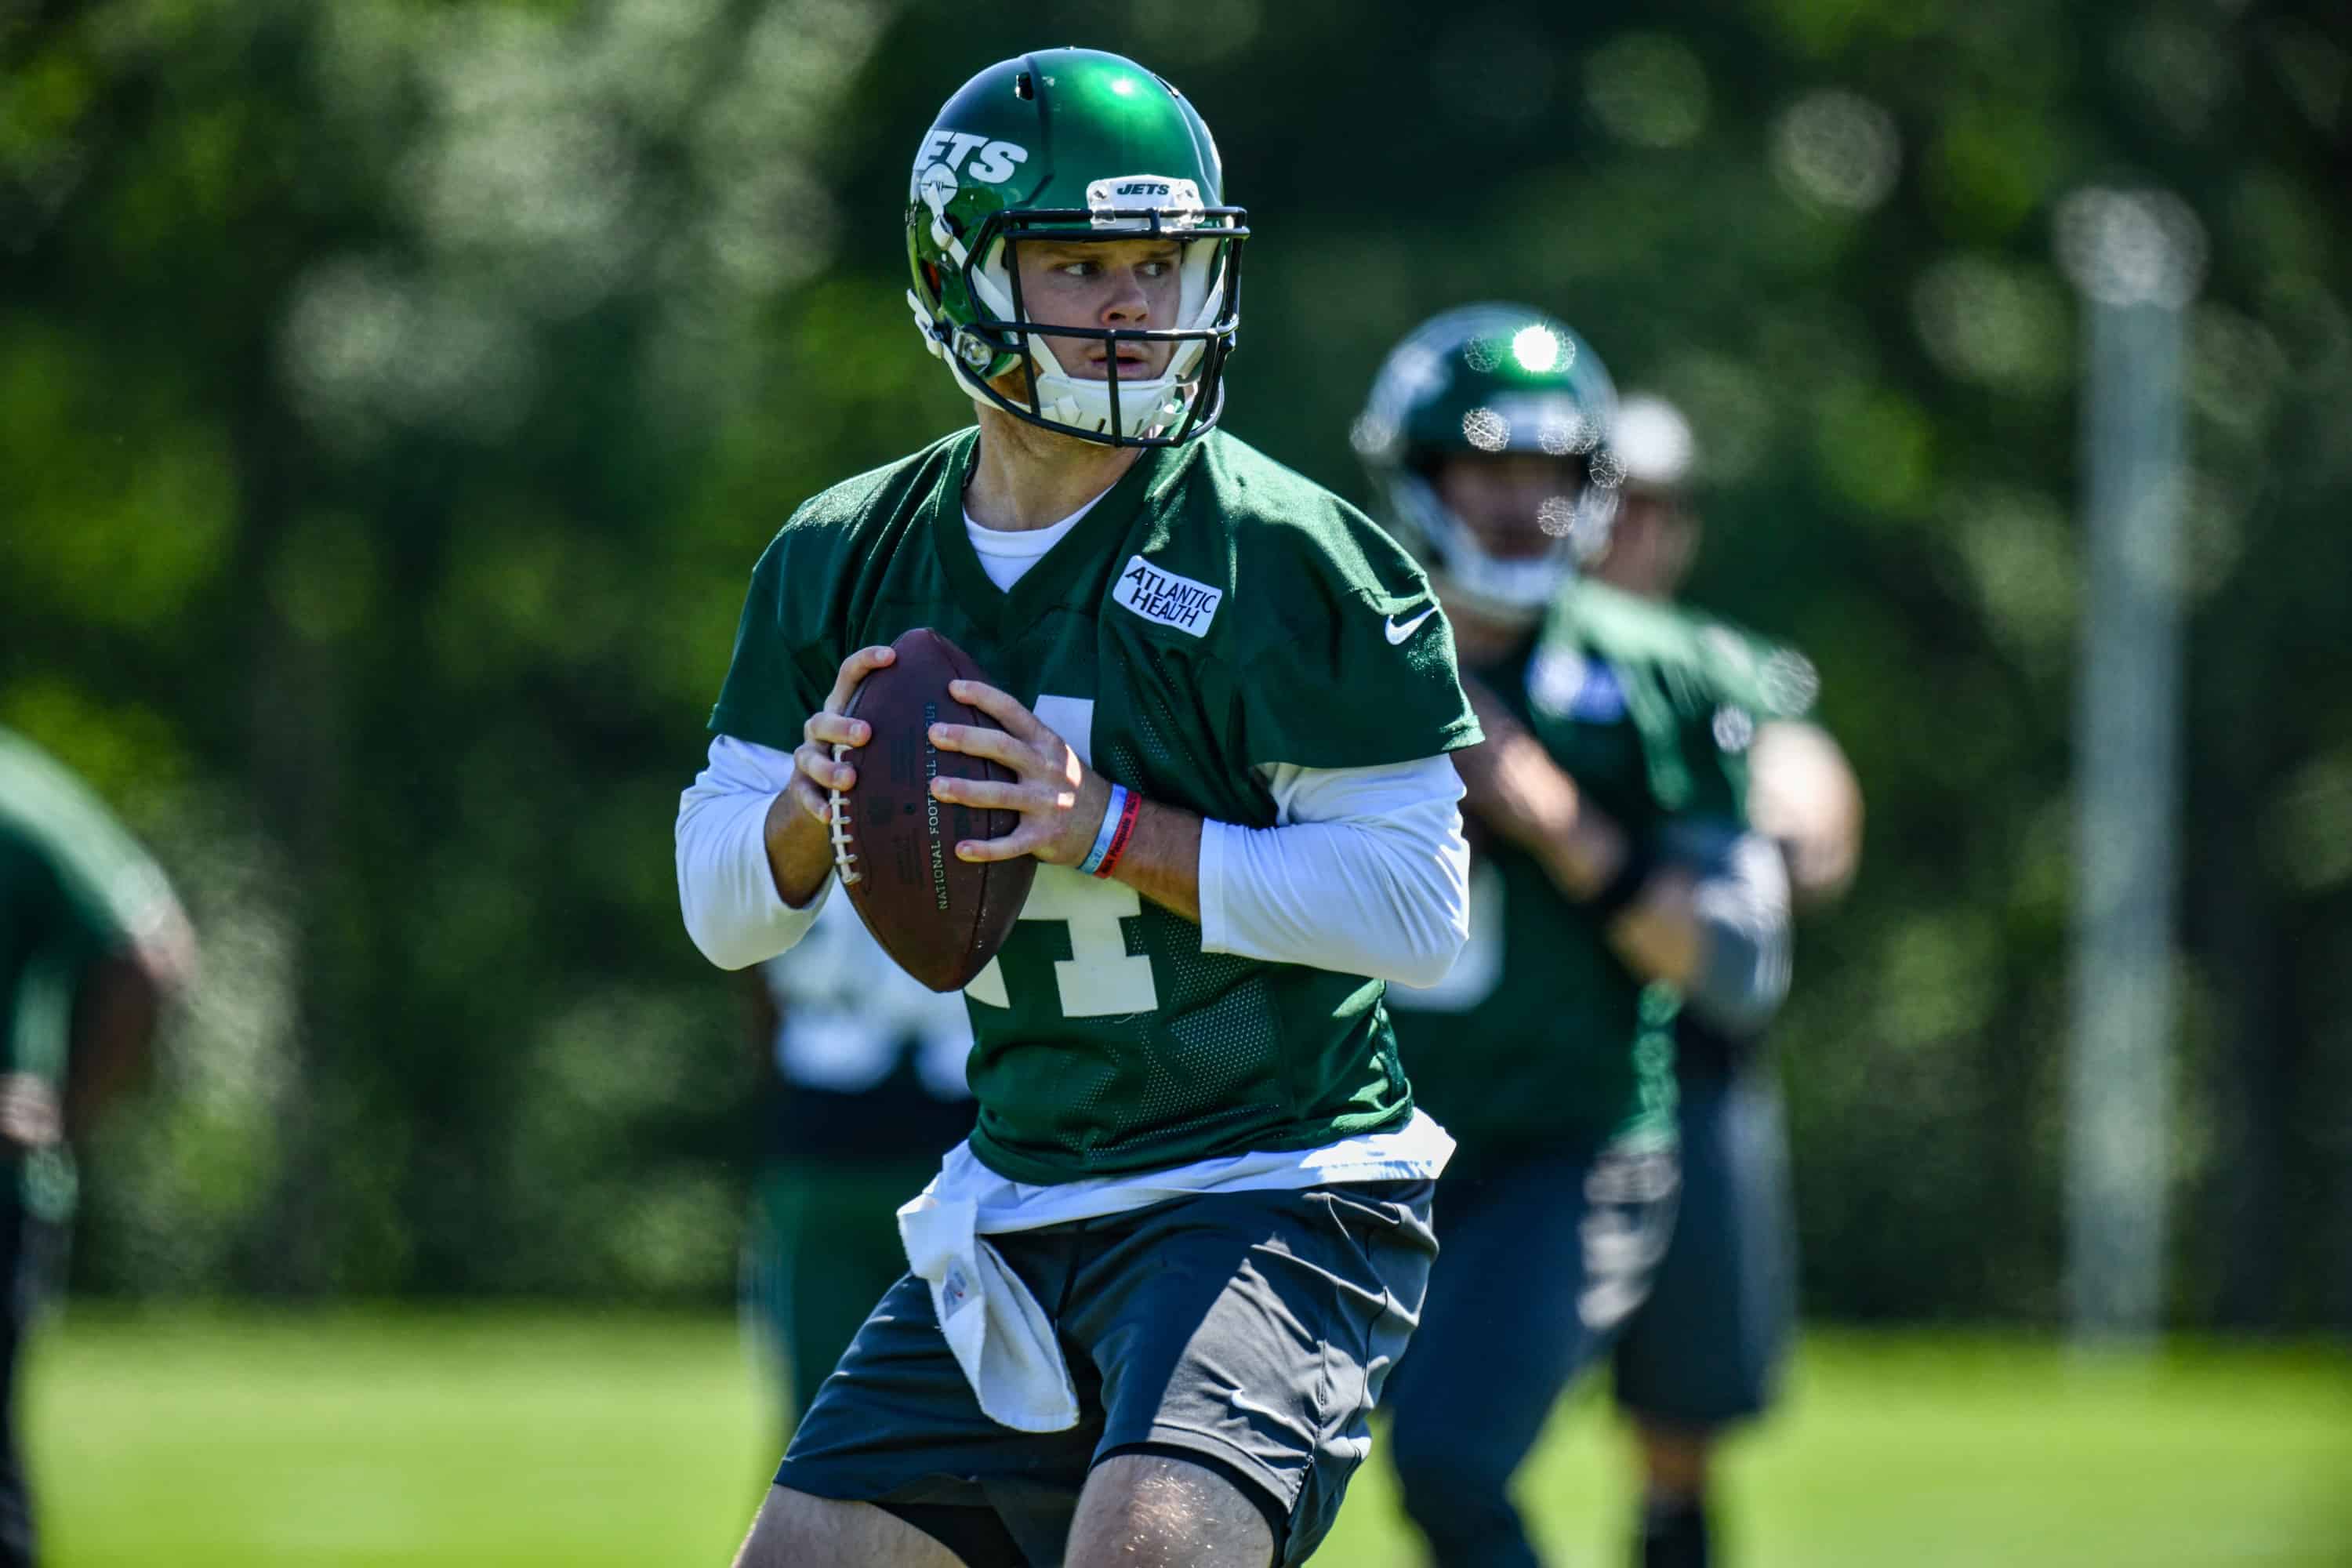
Sam Darnold over 22.5 passing touchdowns
Sam Darnold produced a decent 4.1 percent TD rate on 31 pass attempts per game last season as a rookie and ended up with 17 touchdowns in only 13 games. Had Darnold played all 16 games he would’ve thrown for 21 touchdowns based on that same TD rate, just under his 2019 TD total prop of 22.5. Since 2010, there have been 18 quarterbacks drafted in the first four rounds of the draft who played at least 10 games in both their rookie and second years in the NFL. Of these 18 QBs, 11 increased their touchdown rate the next season. 11 of the 18 QBs also threw more than the 22.5 TDs during their second seasons. If you were to just isolate quarterbacks drafted in the top-5 like Darnold, these QBs in aggregate increased their TD rate from 3.7 percent to 4.8 percent in year two.
In addition, Darnold faced a difficult set of pass defenses in 2018. Last year the Jets had to face six of the eight defenses with the lowest passing touchdown rate allowed in the NFL, including the three pass defenses with the lowest rates in Minnesota, Cleveland, and Jacksonville. Darnold will most likely not face as difficult a schedule of pass defenses this season.
Looking back on it, the fact that Darnold could even produce a touchdown rate as high as 4.1 percent with possibly the worst offensive line in the NFL last season was a minor miracle. Darnold played last season with a set of wide receivers who ranked 65th, 82nd, and 83rd in DVOA. He does get some reinforcements in the way of reliable slot receiver Jamison Crowder as well as Le’Veon Bell at running back. In 2017, Bell produced a 55 percent success rate as a receiver out of the backfield, good for 11th-best in the NFL among running backs. He replaces Isaiah Crowell, who produced a poor 46 percent success rate last season, 36th among RBs with at least 20 targets. The addition of Bell, both as a runner and as a receiver out of the backfield, should help Darnold become more efficient which will lead to more extended drives. The Jets led the NFL last season in drives ending in a 3-and-out.
Maybe the most important factor in Darnold’s increase in touchdowns this season will be more snaps for wide receiver Robby Anderson. Six of Darnold’s 17 touchdown passes went to Anderson, including three in the final four games of the season. Anderson only played 71 percent of the total snaps in the first 11 games when he was active, but that number increased to 94 percent of the snaps in the final three games. In those three games, Darnold threw 5 touchdowns, a 4.9 percent touchdown rate, and 7.5 yards per attempt. It is no coincidence that Darnold’s touchdown rate and yards per attempt for both were much better in those final three games where Anderson played a much larger role in the offense.