- NFL use of the Tight End position
- Finding a good Tight End is the hardest thing to do for fantasy football
- Setting and using the Tight End market
Make sure you don’t miss any part of our fantasy football draft prep by checking out our fantasy football draft kit, which will feature all of Rich Hribar’s articles, rankings, and a printable cheat sheet
![]()
After beginning this series off with a look at scoring and drive production, play calling, and a four-part series on red zone production, we’re finally moving our focus over to the positional side of fantasy breakdowns. The plan here is each week we are going to take a top-down view of each position, highlighting how players score their fantasy points and then cap it off with rankings and draft targets for each position. Leading things off, we’re just going to hold our noses and dive into the worst position from top to bottom for fantasy purposes… tight ends.
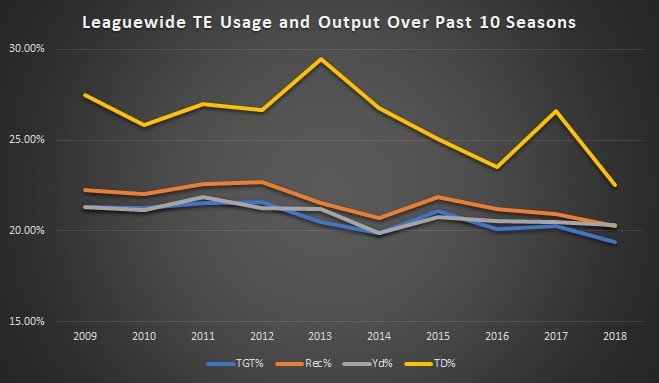
Even though the tight end position is made up of the most versatile and athletic group of players that have ever played the position, use of the tight end in the NFL in totality has deflated over the past decade. The tight end position has settled in comfortably around the lower 20-percent mark in terms of league-wide targets, receptions, and yardage, but their target rate as a position has dipped below 21 percent in five of the past six seasons with an extreme trend in declining overall targets over the past three seasons. Over the past three years, overall tight end targets have dropped by 94, 175, and 156 total looks from the season prior.
Even from a touchdown perspective, the position has sagged. After a small bounce back in scoring rate compared to the league in 2017, the position produced their lowest collective scoring rate in 2018 and have been at 25 percent or fewer of the league-wide passing scores in three of the past four seasons after averaging 27.2 percent of the passing scores from 2009-2014.
With the tight end position being as talented as ever before, we’re still seeing a steady reduction in the use of the position. The question is why?
The two answers that immediately come to mind are the increased use of third and fourth wide receivers while teams are now using their backfields more and more in the passing game. Running backs have out-targeted the tight end position in each of the past two seasons, receiving 371 more targets as a position over those past two years. Running backs have accounted for their highest rates in terms of league-wide targets, receptions, and receiving touchdowns in each of the past two seasons. Nine different running backs had at least 15 percent of their team’s targets a year ago with four players accruing at least 20 percent of their team looks. Just seven tight ends reached a 15 percent team target share with three reaching 20 percent.
Top-12 Scoring Tight End Output Over the Past 10 Years
| Year | PPR Pts | Rec | ReYd | ReTD |
|---|---|---|---|---|
| 2018 | 2249.6 | 838 | 9952 | 69 |
| 2017 | 2069.7 | 784 | 8578 | 72 |
| 2016 | 2177 | 842 | 9574 | 64 |
| 2015 | 2424.1 | 873 | 10384 | 86 |
| 2014 | 2333 | 827 | 9860 | 89 |
| 2013 | 2402.3 | 834 | 9928 | 96 |
| 2012 | 2287.1 | 857 | 9447 | 80 |
| 2011 | 2503.9 | 898 | 10867 | 85 |
| 2010 | 2129.9 | 779 | 8980 | 76 |
| 2009 | 2451.6 | 900 | 10428 | 85 |
The very top of the position was able to have their highest-scoring season since 2015, but as you can see, the fantasy scoring and the touchdown output from those players is still nowhere near where it was four-plus years ago and prior. Also, the position in 2018 was anchored by four big-time producers, a solid producer, and then followed and by a sea of pedestrian inconsistency. Both George Kittle and Travis Kelce broke the all-time receiving yardage record for a tight end in a single season last year while Zach Ertz set the all-time receptions record. Tack on Eric Ebron’s 14 total touchdowns and that group did almost all of the lifting for the position while what followed them in terms of fantasy scoring was some of the lowest scoring output we’ve seen over the past decade. Once you got to the TE6 in overall scoring last season, you found nothing but fantasy vagabonds compared to what the position has produced in comparison to the players that have occupied those spots prior.
Top-15 Overall PPR Scorers For TE in 2018
| TE Rank | Player | Points | Lowest Since |
|---|---|---|---|
| 1 | Travis Kelce | 294.6 | 2017 |
| 2 | Zach Ertz | 280.3 | 2017 |
| 3 | George Kittle | 258.7 | 2017 |
| 4 | Eric Ebron | 222.2 | 2017 |
| 5 | Jared Cook | 193.6 | 2015 |
| 6 | Austin Hooper | 163 | 2003 |
| 7 | Kyle Rudolph | 151.4 | 2008 |
| 8 | Trey Burton | 147.1 | 2008 |
| 9 | David Njoku | 143.9 | 2008 |
| 10 | Vance McDonald | 133 | 2005 |
| 11 | Rob Gronkowski | 131.2 | 2008 |
| 12 | Jimmy Graham | 130.6 | 2008 |
| 13 | Evan Engram | 126.3 | 2008 |
| 14 | OJ Howard | 120.5 | 2008 |
| 15 | Jordan Reed | 119.8 | 2008 |
Multiplicity
From a value-based stance, you can see the edge in which having one of those top-four scorers provided over the field. Finding those scorers who provide that high-end, starting-caliber, wire-to-wire consistency at the tight end position is harder to do than any of the other positions.
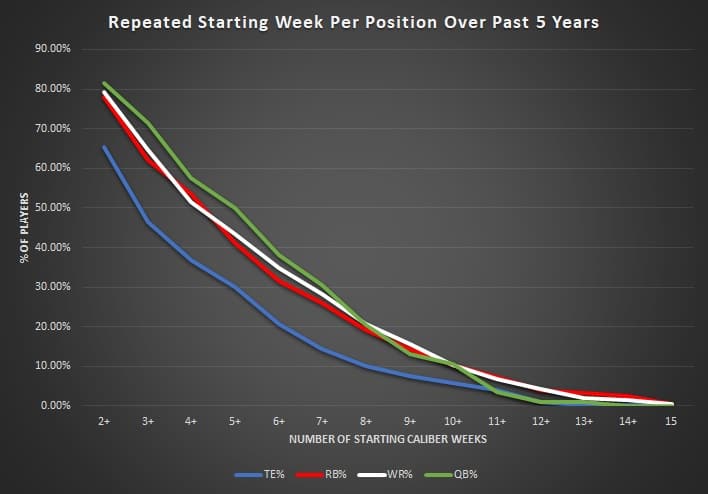
No position has a worse rollover in terms of week-to-week consistency than tight end and it’s not particularly close. This is largely because their opportunity is the smallest of the skill positions and the players who make up the position are reliant on touchdown production to carve out top-scoring weeks over their peers. Over the past five seasons, less than half (46.4 percent) of the players that produce a starting caliber-week in season (excluding Week 17) at tight end went on to produce three or more starting-caliber weeks in that same season while just 20.7 percent went on to post six or more starting weeks in the same season.
In 2018, 65 different tight ends produced a top-12 scoring week. Of those 65, just 25 of them produced three or more starting weeks while just six tallied six-plus weeks and only the big four mentioned above had seven or more starting-caliber weeks of production a year ago.
Finding the players who continually post those consistent weeks is a moving target, though. Only Travis Kelce (five seasons) and Zach Ertz (two) have running streaks with eight or more games that registered as starting-caliber weeks in a season.
We inherently know a lot of variance goes into fantasy football, but when we factor in what we believe we know about the top of the tight end position coming into a season, it’s proven that we aren’t exactly the best at setting the market. Using actual draft position in fantasy leagues to diagnose those consistently high-scoring players is easier said than done.
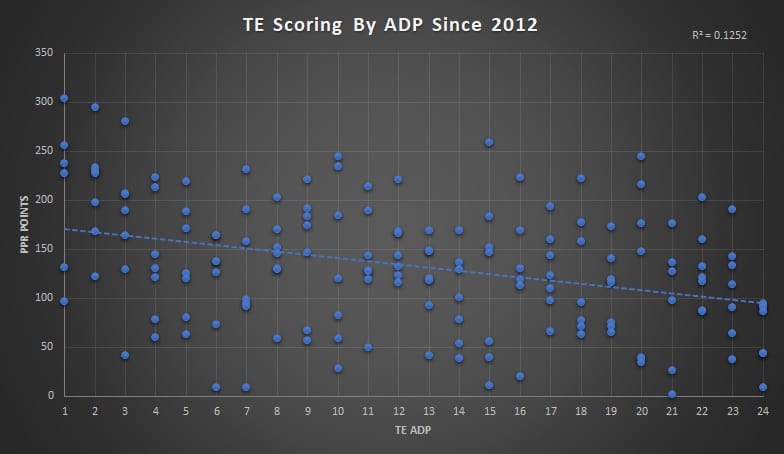
While we’ve been fairly good at the TE1-TE3 spots over the trendline, many may not even recall that Rob Gronkowski was the actual TE1 in drafts last season given how things played out with him being a ghost most of the season and the big-three record-breakers dominating our attention.
I can assure you that those who drafted him remember and can attest that missing on an early tight end is crippling. Not only does it make your team have to chase weekly tight end points like ~75 percent of your league will be doing, but your initial roster construction left you chasing running back and wide receiver production in your draft behind your league mates as well, forcing increased stress on you to nail your player evaluations.
Opportunity Cost
It’s not just the consistency or the scoring edge over the field that allures fantasy owners to take an early tight end, but also the peace of mind owners get in not having to use multiple transactions on the position throughout the season. Getting that type of output means you don’t have to deal with the micro-management of unproductive players at an inherently unproductive position. But this also where value-based drafting can lead you away from an overall optimal decision from a team-building stance.
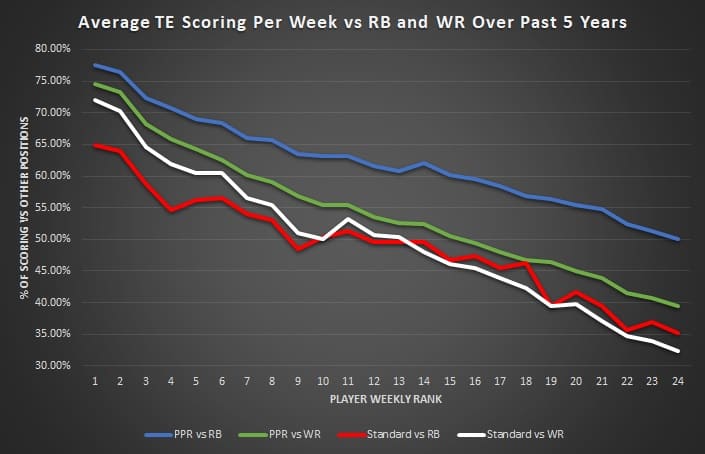
This is why we’re seeing more and more leagues are adopting a “TE Premium” for tight ends in regard to scoring. In those formats, tight ends will get more points per catch than the other positions because they just can’t pace the scoring juice from those spots while you only need to roster one in the majority of starting lineups. Over the past five seasons, the average weekly TE1 has only produced 77.5 percent of the fantasy output as the top-scoring running back in PPR formats and 74.5 percent of the top-scoring wide receiver. There’s a linear decline as we move down the line at the position. In standard leagues, the subsequent drop off isn’t as direct, but the production is much worse in relation to other skill positions once you strip away points per reception. In standard formats, you shouldn’t be entertaining going after an early tight end.
Even in 2018 with three record-breaking tight ends, the top of the position couldn’t match that of running back and wide receiver. The weekly TE1 only produced only 75.7 percent of the points as the RB1 and 73.7 percent of the WR1in PPR formats while having a direct drop off as you moved through the scorers.
If you’re talking about the baseline of a position, the weekly TE12 scores on par with the RB30 and WR37 in standard formats while those marks are the RB28 and WR38 in PPR formats. This is where those who use value over replacement player (VORP) or a value-based drafting (VBD) mentality can be led into coveting one of those top options at the position. For one, we already just highlighted that finding those guys who rollover that type of production consistently are not only scarce, but have marginal year-to-year carryover, and second, the context of matching the ceiling production and predictability of weekly scoring at the running back and wide receiver positions isn’t something the tight end position is capable of replicating.
Looking at the main three tight ends who are being selected early this season — Kelce, Ertz and Kittle — and compare their production last season to the field of running backs and wideouts, Kelce ranked 24th in mean weekly scoring ranking and 55th in standard deviation of that ranking. Ertz ranked 28th in ranking and 51st in deviation while Kittle ranked 31stt in ranking and 33rd in deviation. That means that all are fairly priced this summer based on their 2018 output, but keep in mind that all three of these players just broke all-time records and have a probability their 2018 seasons could very well be there highest-scoring fantasy seasons for their remaining careers. While you may be paying for the comfort of not having to use multiple players for one position, you are also paying a tax added on that these players are coming off seasons which are unlikely to repeat themselves, even if they do still continue to outrank their peers at the tight end position.
A player like Kelce has provided the most high-level consistency at tight end, but the player behind him currently in ADP — JuJu Smith-Schuster — also accounted for more top-50 scoring weeks among RB/WR/TE than Kelce did and plays a position that has a far greater supply and demand. There’s a trade-off in opportunity cost. In the same measure used above, of the top-100 players, Smith-Schuster ranked 16th in mean weekly scoring rank and 14th in standard deviation.
The other area where a value-based approach masks true draft relation is the supply and demand element of fantasy football. A traditional fantasy football lineup requires only one tight end, but at least two running backs and wide receivers. Adding on injury rates, players busting, a potential third starting wide receiver requirement and the possibility of added flex spots, the demand for running backs and wideouts is much greater than the other positions. Even before factoring in that, those players score more points as we just showed; they are inherently more expensive in drafts because the need to obtain those players is higher.
What a value-based approach fails to fully encapsulate is that demand in relation to cost. While your board may be telling you that you should take a tight end versus a wideout or a running back at a specific point because his value over the baseline player of his position is greater than anyone else available, what it doesn’t account for is where the cost of the other positional baselines is.
As of the most current ADP, the TE6 is being drafted alongside the RB28 and the WR26 while TE12 is being drafted alongside the RB47 and the WR49. Including bench spots and average drafted players, the true baseline for the tight end position for 12-team leagues that are required to start one is the TE18. The TE18 carries an average ADP of 149.9 overall in drafts over the past five years and is currently keeping the company of the WR56 and the RB52 in drafts.
Compared to the other baselines of the positions — RB34 and WR31 or WR49 depending on starting two or three receiver requirements — the running back baseline is set at pick 80 while the wide receiver baseline is set at pick 75 for leagues that are required to start two wideouts and pick 127 for leagues that require three starters. If your baseline player at the position in terms of generating your value system is being selected ~75 picks later than the baseline at another position, you’re forfeiting part of your edge gained by being forced to take on — and be correct on — players that fall below those value-generated baselines at other positions.
I’m not totally against taking any of the big three tight ends because I’m inherently alright with leaving my drafts with a roster weakness — a strategy we’ll get into later on — but I do find all three overvalued coming off potentially career seasons, while I believe there’s far greater inherent value by paying down for upside on the position, such as was the case with Kittle and Ebron last season and was the case with Ertz in 2017. At the end of the week, I’ll discuss my plan of attack for the tight end position in drafts this season with full player rankings at the position after we look at player archetypes and scoring correlations at the position in the middle of this week.