- NFL scoring reached historic levels in 2018
- Can the Chiefs sustain their historic output in 2019?
- Which Teams Will Score More and Fewer TDs in 2019
Make sure you don’t miss any part of our fantasy football draft prep by checking out our fantasy football draft kit, which will feature all of Rich Hribar’s articles, rankings, and a printable cheat sheet
![]()
Welcome, Sharp Football Fans! For those that are new to this offseason series, allow me to briefly run things down. We’re taking a look back at the 2018 season, adding data points and notes with an application in the form of regression analysis that can serve as bullet points to diagnose 2019 player and team expectations. The goal is that once we reach mid-to-late August that all these posts serve to make up a draft guide. To start our downhill journey into August drafts, we’re taking a top-down look at things from a team level, beginning with scoring and drive production.
After nearly a decade straight of rising offensive production across the league, the 2017 season was an offensive sinkhole. Teams averaged their lowest scoring rate since 2009 (21.7 points per game) and we had 108 fewer rushing and receiving touchdowns than there were in the 2016 season. All in all, it was an offensive disaster, but one that we pegged as more of a speedbump rather than the beginning of a new trend given the continuously offensive boom that preceded that sharp downturn paired with the still fortuitous rules in place to aid offensive football. We expected scoring and touchdowns to rebound, and they did exactly that in the 2018 season.

Teams in 2018 combined to score the most points per game (46.6) than any season in league history, on the strength of scoring the most offensive touchdowns ever in an NFL season. On a per-possession basis, teams scored a touchdown on 22.4 percent of their possessions (the highest rate ever) and were able to put up points of any kind on the board on 36.4 percent of their possessions.
We had three teams (the Saints, Chiefs, and Rams) score on over 50 percent of their possessions in 2018 after seeing just seven teams total reach that rate of scoring efficiency per drive over the previous 19 seasons per drive data was tracked per Pro Football Reference.
Teams to Score on 50 Percent of their Drives Since 1999
| Team | Year | Score/Drive | n+1 | Pts | n+1 | oTD | n+1 |
|---|---|---|---|---|---|---|---|
| NO | 2018 | 56.9% | TBD | 504 | TBD | 59 | TBD |
| KC | 2018 | 55.2% | TBD | 565 | TBD | 66 | TBD |
| LAR | 2018 | 52.7% | TBD | 527 | TBD | 55 | TBD |
| NE | 2017 | 52.1% | -9.00% | 441 | 17 | 48 | -1 |
| ATL | 2016 | 55.8% | -12.16% | 540 | -187 | 58 | -25 |
| DEN | 2013 | 51.1% | -8.15% | 606 | -124 | 71 | -16 |
| NO | 2011 | 52.6% | -12.93% | 547 | -86 | 62 | -9 |
| GB | 2011 | 51.8% | -12.46% | 560 | -127 | 63 | -14 |
| NE | 2010 | 51.0% | -1.56% | 518 | -5 | 56 | 1 |
| NE | 2007 | 57.0% | -9.06% | 589 | -179 | 59 | -17 |
All of these seasons occurred from the 2007 season on to give you a better gauge on the starting point of when we had an era change for offensive football. But also, all of those previous teams scored a lower rate per possession the following season with all but one matching its offensive touchdown output with just one other team matching its overall scoring production. For as good as all these offenses were a year ago, we should anticipate all three to have a reduction in scoring output this upcoming season. Not all regression is a scarlet letter for avoidance — we’re projecting all three offenses to still be among the leagues best — but the output for many players on these rosters have very good odds of potentially being ceiling performances for their careers. That alone can allow you to play the market in fantasy drafts on specific players and know when and where you’re paying that tax.
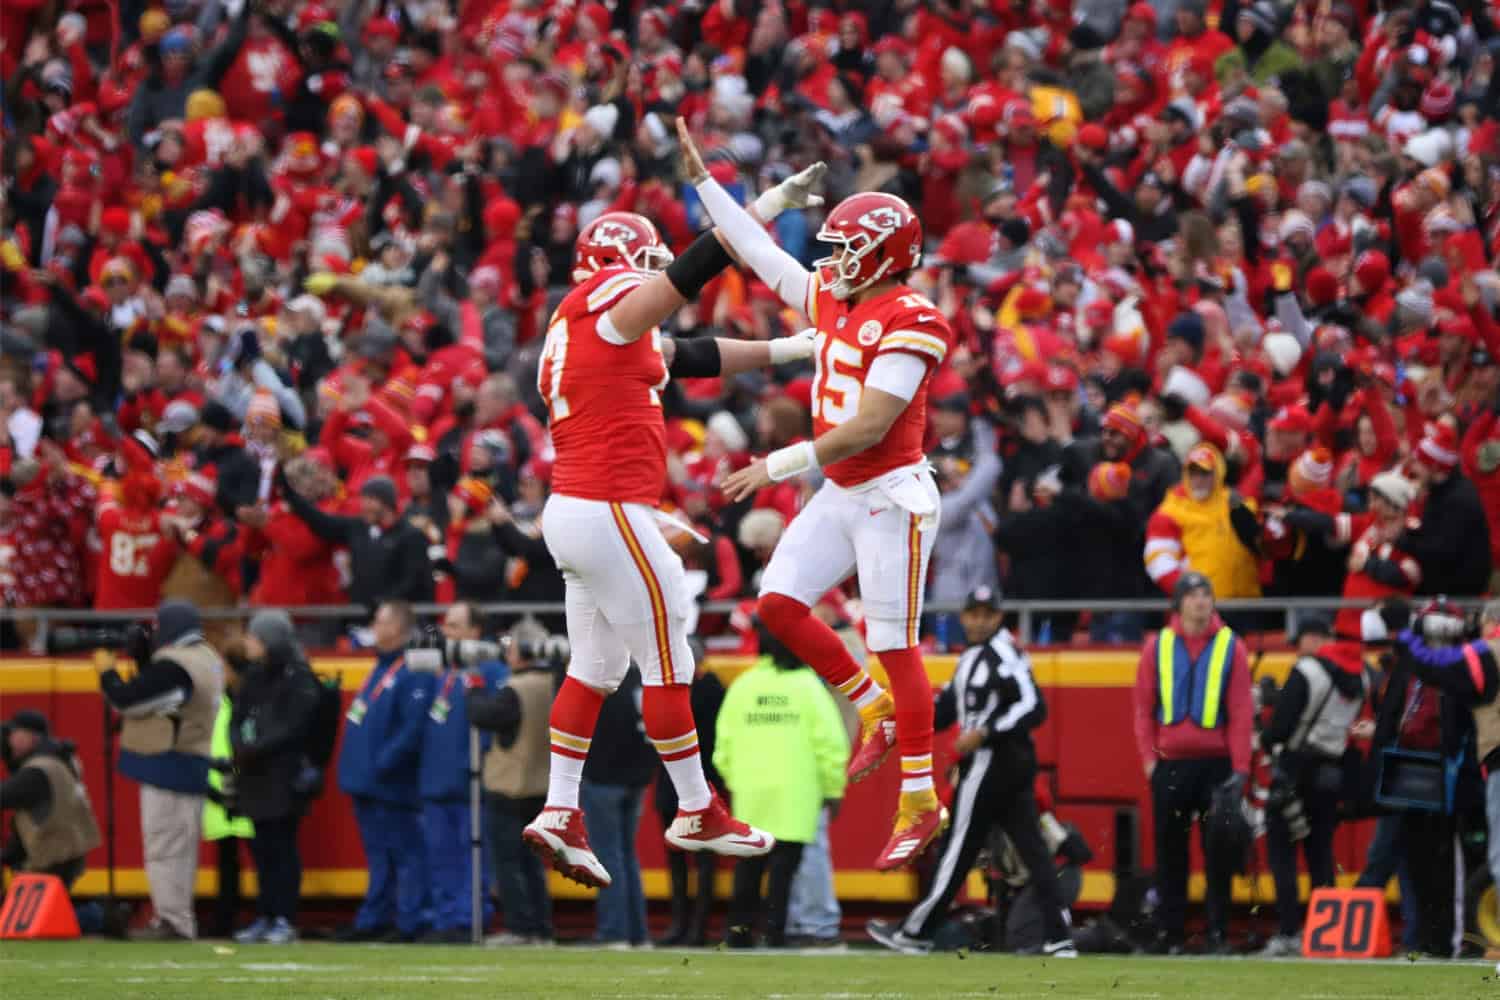
While the Saints did score at a higher rate per drive than the Chiefs last season, Kansas City put on an encompassing offensive assault that was unprecedented on a per drive and play basis.
2018 Chiefs Offense
| Cat. | Total | Rank Since 1999 |
|---|---|---|
| Points Per Play | 0.57 | 1 |
| Yards Per Play | 6.82 | 2 |
| 1st Down/Play % | 36.4% | 1 |
| TD/Play % | 6.6% | 1 |
| Yards/Drive | 41.2 | 3 |
| Score/Drive % | 55.2% | 4 |
| TD/Drive % | 40.5% | 2 |
From a yards per play basis, only the 2000 Rams (6.96 yards) were better than last year’s Chiefs team. Only the 2011 Saints (42.8 yards) and 2007 Patriots (41.5 yards) were better in yards per drive. Only that 2007 Patriots was better in percent of drives to end in a touchdown (43.7 percent) while that Patriots team (57 percent), last year’s Saints (56.9 percent) and the 2016 Falcons (55.8 percent) scored points at a higher rate of possessions. Just to reiterate, this is merely the context that running this hot is hardly sustainable year over year, anything other than maintaining the greatest offense ever would be considered regression by definition.
Even in the highest-scoring season ever, not everyone came along for the ride. There was still another side of the coin. While the Chiefs put on one of the most prestige offensive performances ever, the Arizona Cardinals put on of the worst offensive displays of the past decade.
2018 Cardinals Offense Per Drive
| Cat. | ARI 2018 | Lowest Since |
|---|---|---|
| Score/Drive% | 19.8% | 2011 |
| TD/Drive% | 13.2% | 2018 |
| Punt/Drive% | 51.9% | 2016 |
| Points/Drive | 0.99 | 2011 |
| Yards/Drive | 21.1 | 2012 |
Arizona was the first team in six seasons to score on fewer than 20 percent of their possessions and just the third team since 2006 to do so. Over the 20 seasons of drive data we have, just 11 teams have managed to score at that low of a rate while having the football. Two of those teams were expansion teams in the 1999 Browns and the 2002 Texans. Performing on par with an expansion team is how an entirely new coaching staff gets clipped after just one season. But just as it was with teams on the top, it’s difficult to remain this putrid in back-to-back seasons. Of the previous teams that found themselves in the company of the 2018 Cardinals, all but one — the first to second-year Browns — scored on a higher rate of drives (average of +9.2 percent), scored more points (+5.6 per game) and scored more offensive touchdowns (+10) the year after. Even at this ever-expanding state of emphasis on speed and space, the collegiate game is different than the NFL, but Kliff Kingsbury has never led an offense that finished outside of the top-20 in the nation in total offense dating back to the 2011 season when he took his first offensive coordinating job.
You may have noticed that despite how awful the Cardinals were on offense last season; they actually weren’t even the worst team in the league a year ago in touchdown rate per drive. That mark belonged to the Jacksonville Jaguars, who scored a touchdown on just 12.4 percent of their possessions. League average outside of them was 23.9 percent. Of the 13 teams over the past decade to have a touchdown rate as low as the Jaguars had a year ago, they bounced back to score an average of +13.5 offensive touchdowns the following season. There’s minutia to cut through on an individual player basis in Jacksonville, but at wholesale, their entire offense is currently undervalued by the market, even if they just rebound to league-average production.
Yardage to Touchdowns
That’s because even though the Jaguars were a bad offense last season, they were still producing yardage that suggested that touchdown rate was misfortune. Over the past decade, offensive yardage has an r-squared of .7025 in relation to offensive touchdowns, meaning 70.25 percent of all those scores can be explained by yardage gained. Under that umbrella, the 2018 Jaguars scored 10 fewer touchdowns than their yardage gained suggested they should have scored. Over the previous 20 seasons, they were just the 16th team to have negative touchdown production in the double-digits off of their expected output. Those teams on average scored +13.9 offensive touchdowns the following season.
On the fortunate end of the spectrum, we had five teams outproduce their expected offensive touchdown per yardage marks by double digits, the most ever in one season. There have been 23 instances of teams doing so prior to last season and on average those teams scored 11 fewer touchdowns the following season with just four of those teams matching their touchdown total from the previous season. For a quick reference, here’s the layout for all teams a year ago in expected touchdown output per yardage.
2018 Expected TD Output Per Yardage
| Tm | TotYd | oTD | Ex. TD | Diff |
|---|---|---|---|---|
| KC | 6810 | 66 | 45 | 21 |
| NO | 6067 | 59 | 40 | 19 |
| SEA | 5653 | 50 | 38 | 12 |
| IND | 6179 | 52 | 41 | 11 |
| LAR | 6738 | 55 | 45 | 10 |
| LAC | 5962 | 48 | 40 | 8 |
| PIT | 6453 | 51 | 43 | 8 |
| CHI | 5502 | 44 | 37 | 7 |
| CIN | 4972 | 40 | 33 | 7 |
| ATL | 6226 | 47 | 41 | 6 |
| CAR | 5972 | 45 | 40 | 5 |
| NE | 6295 | 47 | 42 | 5 |
| CLE | 5900 | 44 | 39 | 5 |
| TB | 6648 | 47 | 44 | 3 |
| MIN | 5529 | 39 | 37 | 2 |
| MIA | 4638 | 33 | 31 | 2 |
| PHI | 5845 | 41 | 39 | 2 |
| DEN | 5602 | 37 | 37 | 0 |
| GB | 5905 | 39 | 39 | 0 |
| HOU | 5802 | 38 | 39 | -1 |
| DAL | 5501 | 35 | 37 | -2 |
| ARI | 3865 | 24 | 26 | -2 |
| DET | 5236 | 33 | 35 | -2 |
| NYG | 5697 | 36 | 38 | -2 |
| TEN | 5002 | 31 | 33 | -2 |
| NYJ | 4787 | 29 | 32 | -3 |
| BAL | 5999 | 37 | 40 | -3 |
| BUF | 4778 | 28 | 32 | -4 |
| WAS | 4795 | 28 | 32 | -4 |
| SF | 5769 | 33 | 38 | -5 |
| OAK | 5379 | 28 | 36 | -8 |
| JAX | 4832 | 22 | 32 | -10 |
We’ve identified a few teams that should score fewer or more touchdowns on offense based on basic regression to the mean, but what about finding teams that should have reversion in the types of touchdowns they are scoring?
Over the past decade, 65.8 percent of the offensive touchdowns scored were via passing. That mark in 2018 was right on par at 65.9 percent. Even in a passing league. two teams — the Bills and Ravens — last year managed to have 50 percent or more of their offensive touchdowns come through the ground. Just five teams over the past decade have had back-to-back seasons dependent on rushing touchdowns to make up at least half of their team total, with it happening just once since the 2009 season. Of the 34 teams other than the Bills and Ravens to do so over that span, 27 teams posted fewer rushing touchdown totals than the previous season with an average loss of 5.9 rushing scores as a team per season. On the flip side, 30 of those teams saw a spike in passing touchdowns with an average increase of 7.3 passing scores. We’re not drafting either Lamar Jackson or Josh Allen based on their passing acumen, but both are solid bets to take a step forward in passing touchdown output in their second seasons while their team dependency on rushing touchdown production should be expected slide a bit.
From the pass-heavy side of scoring, seven teams had 75 percent or more of their offensive scores come through the air.
| Tm | PaTD% | RuTD% |
|---|---|---|
| MIA | 78.79% | 21.21% |
| SF | 78.79% | 21.21% |
| MIN | 76.92% | 23.08% |
| TB | 76.60% | 23.40% |
| ATL | 76.60% | 23.40% |
| KC | 75.76% | 24.24% |
| IND | 75.00% | 25.00% |
40 of the 59 previous teams to rely on passing touchdowns this heavily failed to throw for more passing touchdowns the following season with an average loss of 7.2 fewer passing scores for those teams. 49 of those teams seen their rushing touchdown spike with an averaged increase of 5.3 more rushing touchdowns per team. Primary short-yardage backs on these teams could have increased touchdown value that isn’t baked into their expectations. Players such as Devonta Freeman, Dalvin Cook, Marlon Mack, and Damien Williams have scoring upside already at their costs, but scoring value can stem from the Miami, San Francisco and Tampa Bay backfields that isn’t priced into these situations due to ambiguity.
In San Francisco, the seven rushing touchdowns by the 49ers last season were the fewest for a Kyle Shanahan-coached offense over his 11 seasons as a play-caller. Tevin Coleman has 19 carries inside of the 5-yard line (converting seven for touchdowns) compared to 14 combined from Matt Breida and Jerick McKinnon, who have combined to convert five of those for touchdowns. Even a year ago, the 49ers gave Alfred Morris more carries inside of the five than Breida. Perhaps Jalen Hurd even gets a look at some short scoring opportunities, but early on, Coleman may be a potential value with the risk of a timeshare being baked into required draft capital.
No team had fewer rushing touchdowns over the past three seasons than the Dolphins did during Adam Gase’s tenure. Kenyan Drake has had just five such carries through three NFL seasons, converting two for scores. Brian Flores and Chad O’Shea come from a New England system that has used multiple backs, but the underutilized Drake is still the best back on the Miami roster.
In Tampa Bay, Ronald Jones did convert his lone such carry for a touchdown a year ago while Peyton Barber has converted 7-of-20 such carries for touchdowns for his career but converted just four of 12 carries a year ago for scores, below the league rate. This is a backfield that may be a value trap regardless of who takes the bulk of touches, but the signals are there for more rushing scores coming from the team collectively.