As we are pushing into July and further downhill towards the 2022 fantasy season, we are going to extend our top-down approach that started with a look at the state of leaguewide production and usage at each skill position for fantasy by looking at team performance and output.
The goal is that come late August, we have covered all corners of the fantasy Earth from a team, player, position, and game theory stance to accurately calibrate our draft strategy for this upcoming season.
Kicking things off as we dive into team performance and potential regression notes to apply to the 2022 campaign, we are looking at how the league and teams performed on a per-possession basis a year ago.
League-wide Scoring and Touchdown Rates per Drive Since 2010
*All NFL Drives excluding ones that ended in kneel-downs
| Year | Drive/Gm | oTD/Gm | Score % | TD % |
|---|---|---|---|---|
| 2021 | 10.4 | 2.48 | 39.46% | 23.94% |
| 2020 | 10.4 | 2.74 | 41.71% | 26.43% |
| 2019 | 10.6 | 2.4 | 37.54% | 22.79% |
| 2018 | 10.8 | 2.53 | 37.93% | 23.41% |
| 2017 | 11.1 | 2.21 | 35.16% | 19.92% |
| 2016 | 11 | 2.42 | 37.01% | 21.95% |
| 2015 | 11.2 | 2.38 | 35.72% | 21.19% |
| 2014 | 11.2 | 2.33 | 35.43% | 20.92% |
| 2013 | 11.6 | 2.39 | 35.04% | 20.53% |
| 2012 | 11.3 | 2.29 | 34.87% | 20.21% |
| 2011 | 11.5 | 2.26 | 34.02% | 19.73% |
| 2010 | 11.4 | 2.29 | 33.62% | 20.06% |
The wide lens approach from a league perspective further highlights how strong offensive performance remains despite having some recoil coming off a historic offensive season in 2020 that was aided by unique playing conditions.
After five teams scored on at least 50% of their possessions in 2020, just two teams reached that mark a year ago. In 2020, just five teams managed to score a touchdown on fewer than 20% of their drives, but we saw 11 teams do so a year ago.
Scoring and touchdown rates per drive were not as efficient across the board as the year prior, but you can still see how offenses are operating at a hyper-efficient level big picture. Possessions per team continue to remain lower per game compared to a decade ago as teams are better at utilizing their drives.
In 2021, NFL offenses scored on 39.5% of their drives, a rate bested by 2020, but well above the next-highest rate here in this sample. Offenses capped drives off with a touchdown on 23.9% of all drives, which follows suit. The only department where 2021 was not better than every other season outside of 2020 was in terms of offensive touchdowns per game, just falling short of the 2018 season.
Year-Over-Year R-Squared Correlation Per Drive Since 2010
| Category | All | Top-10 | Bottom-10 |
|---|---|---|---|
| Score/Drive% | 0.2899 | 0.1166 | 0.0641 |
| TD/Drive% | 0.1782 | 0.0992 | 0.0694 |
| Off. TD/Gm | 0.1355 | 0.0489 | 0.0486 |
Moving to a more team-specific outlook, looking at the predictability of per drive metrics offers a mixed bag.
Since 2010, just under 30% of a team’s scoring rate per drive can be explained by the output from the season prior, while touchdown performance per drive and offensive touchdowns per game get nearly cut in half in yearly correlation.
When looking at just the teams at the top and bottom of the league those seasons in the major categories, those marks take significant hits.
Top-10 teams in scoring efficiency fare better than bottom-rung teams in terms of scoring output. The fluctuation and volatility of scoring efficiency are strong across the league, but good teams are better at staying good than bad teams are at staying bad. Although we are not solely going to anchor down to correlations this flimsy on their standalone merit, there is value in just knowing that piece of information.
Despite there not being extremely reliable year-over-year correlations on the team level, there are still bulk trends to take away from things here.
Since the 2010 season, 69.3% of the teams that were below average in scoring rate per drive improved the following season. Those teams also averaged an increased average touchdown rate per drive of 4.7% with an average increase of 10 offensive touchdowns per season.
The bad news is just 37.5% of teams in the bottom half of the league in scoring rate per drive then came back the following season and were in the top half of the league. 21% came back the following season and were in the top 10. While neither of those marks is totally impressive, that is still saying that on average six teams in the bottom half of the league from the year prior are going to be top-half scoring offenses while nearly four teams per season are going to flip from being a bottom-half scoring offense to becoming a top-10 one.
From a 2021 perspective, we had nine teams going from bottom-to-top half of the league in the Vikings, 49ers, Bengals, Eagles, Cardinals, Chargers, Rams, and Patriots while the latter five teams all finished in the top 10 in scoring rate per drive a year ago.
On the other side of things, 59.1% of teams in the top half of the league in scoring rate per drive sustained top-half output the following season. Just 18.8% of those teams dropped all the way down to a bottom-10 offense the following season.
The 2021 season saw five teams do just that, with the Falcons, Browns, Dolphins, Panthers, and Texans all bottoming out compared to their 2020 output. The Saints (seventh in 2020 to 22nd last season) and the Seahawks (10th to 21st) were right on the doorstep.
With some of those bulk trends noted, let us dive into per-drive team production from the 2021 season with some takeaways.
2021 Team Per Drive Rates
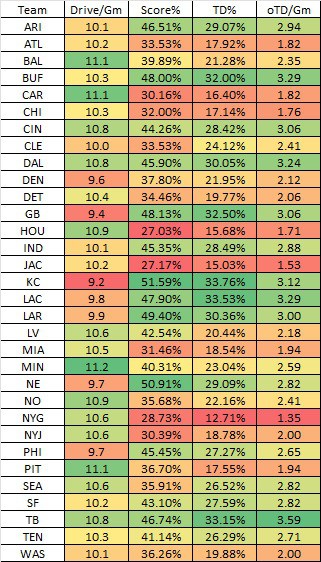
*Drives excluding ones that ended in kneel-downs
Kansas City CHIEFS
The Chiefs led the league in scoring on 51.6% of their drives, which is the fourth consecutive season that Kansas City has scored on over 50% of their possessions. To put how absurd that is into context, just one other team (the 2018-2019 Saints) has scored on half of their possessions in back-to-back seasons.
The Chiefs have had a ton of movement this offseason in revamping their offensive identity, but as of right now, Travis Kelce is their only non-quarterback with an average draft position in the top-50. If the Chiefs are able to sustain this scoring run they are on, then the ambiguity of this roster is going to create some glaring values when the dust settles on the season.
New England PATRIOTS
Did you know that the Patriots scored on 50.9% of their drives last year? A mark only bested by the Chiefs. The rub here was that just 57.1% of their scoring plays were touchdowns, which was 22nd in the league. That mark rates 41st among 46 teams over that sample since 2010 to have 80 or more scoring plays in a season. Albeit a small sample, all five teams worse than them came back to score more offensive touchdowns the following season with an average increase of 10.4% in terms of touchdown production of scoring plays.
The Patriots scored a touchdown on 29.1% of their drives. That was still good for eighth in the NFL last season, but it was the lowest touchdown rate per drive among all teams to score on 50% of their drives since 2000.
As of right now, Damien Harris is the only Patriot being drafted in the top 100, with an ADP of 94th overall the past week in Underdog drafts.
Los Angeles CHARGERS
Brandon Staley may have drawn some ire for his aggressive nature, but the overall results from the Chargers a year ago speak volumes. The Chargers scored on 47.9% of their drives (sixth in the league) and produced a touchdown on 33.5% (second) of their drives. Both of those rates were the highest for the franchise in the 2000s.
Now that Staley has an objectively better defense, what if that makes him even more aggressive moving forward instead of the consensus feel from the public that he will no longer need to remain as aggressive?
Cincinnati BENGALS
Another team that enjoyed their most efficient scoring season of the modern era was the Bengals. Cincinnati scored on 44.3% of their drives, eclipsing the 43.9% rate of the 2005 team. They scored a touchdown on 28.4% of their drives, besting the 2015 team.
The wild part is that the Bengals still clearly have another gear to reach offensively.
Despite their success a year ago, the Bengals still lacked in a number of areas up top. With Joe Burrow coming off an ACL injury, Cincinnati used a cautious approach on offense. Through 13 weeks, they were just 19th in the NFL in neutral pass rate (50.8%).
On first down play calls in neutral game script, the Bengals were 3% below pass rate expectation despite Joe Burrow and this passing game absolutely smashing in those situations.
Burrow ended the season 16th in the NFL in first down pass attempts, despite ranking fifth in completion rate (73.4%), second in passing touchdowns (13), and fourth in yards per pass attempt (8.8 Y/A) when the Bengals were aggressive early.
The Bengals also ranked 29th in the league in pace of play, averaging 30.4 seconds per offensive snap. In neutral game scripts, it was even a tick worse, checking in 30th (32.8 seconds per snap). The Bengals will go from playing the third-best strength of schedule in 2021 to the 26th-ranked schedule in 2022.
That schedule flipping should impact both the aggressiveness and pace of play, but both areas take rational coaching as an input. Improved offensive line play does not.
The weakest link from the 2021 season, the Bengals offensive line ranked 30th in the league in ESPN’s Pass Block Win Rate (49%). Only two teams allowed more sacks than the Bengals during the regular season while only the Bears allowed a higher sack rate per dropback than Cincinnati at 9.6%.
When the Bengals did not allow or take on a drive, they ranked second in the NFL in points per drive (2.83) and touchdown rate per drive (34.1%) as opposed to ranking 11th in points per drive (1.08) and 12th in touchdown rate per drive (9.6%) when they did have a possession with a sack.
Los Angeles RAMS
The Rams were all-in on upgrading their quarterback situation a year ago by acquiring Matthew Stafford and the results immediately produced a Super Bowl win.
The Rams went from 26th in scoring rate per drive in 2020 (36%) all the way up to third a year ago at 49.4%. This was their highest-scoring rate per drive as a franchise in a season outside of 2018.
They rose from scoring a touchdown on 22.3% of their drives in 2020 (23rd) all the way up to sixth a year ago (30.4%).
Las Vegas RAIDERS
From the top of the league to some unique seasons, the Raiders were an odd scoring club in 2021. Las Vegas scored on 42.5% of their possessions a year ago, which was respectable at 14th. Despite that, they were 21st in the league in touchdown rate per drive (20.4%) as touchdowns accounted for 48.1% of their scoring plays, a rate only worse than the Steelers (47.8%) and the Giants (44.2%).
Since 2010, of the 42 teams to kick a field goal on over 50% of their scoring plays, those teams have averaged an increase of 9.4 more offensive touchdowns over the year prior.
Seattle SEAHAWKS
Seattle was on the other end of things here last season. The Seahawks scored on just 35.9% of their drives (21st) but were still tied for 11th in the league in offensive touchdowns and 14th in touchdown rate per drive (26.5%).
An all-or-nothing approach offensively led to the Seahawks averaging 14.5 fewer plays per game than their opponent, the largest per game differential since 2008 at least.
Seattle was second in the NFL in touchdowns scored on drives only needing 1-3 plays (12) and second in touchdowns scored outside of the red zone (17) paired with ranking 23rd in the NFL in drives that went three and out and 23rd in third down conversion rate.
As a result, 73.9% of the Seattle scoring plays were touchdowns, the highest rate in the NFL in 2021. That mark also is the 16th highest rate for a team since 2000. Of the 15 teams ahead of them in that department, just one scored more offensive touchdowns the following season with an average loss of 10.5 touchdowns scored per team the next season.
New York GIANTS
No team was as inept at scoring touchdowns in 2021 as the Giants. They were 30th in the NFL in scoring rate per drive (28.7%) and dead last in touchdown rate (12.7%).
That touchdown rate per drive was the seventh-lowest mark for a team over the previous decade and the lowest rate for a team since the 2018 Jaguars. It was their lowest touchdown rate in a season as a franchise since 2003, when they scored on 11.5% of their drives.
Touchdowns accounted for just 44.2% of the New York scoring plays, the lowest rate for a team in a season since the 2017 49ers. Of the 20 teams with a lower rate than the Giants since 2000, 18 of those teams scored more offensive touchdowns the following season with an average increase of 10.4 touchdowns per team. An extra 10 touchdowns on their 2021 total would still make the Giants a bad offense within the league context (they would have ranked 21st in touchdowns), but that’s how the bar the low has been set for Brain Daboll in his first season in New York.
30% CLUB
The Giants were one of just three teams to score on fewer than 30% of their possessions in 2021, joining the Jaguars and Texans. Historically, teams this bad do see some dead-cat bounce.
Since 2010, 53-of-64 teams to score on that arbitrary bucket of despair increased their scoring rate from the year prior with an average increase of 8.3%. Those teams on average scored 8.0 more touchdowns the following season.
20% TD CLUB
There were 11 teams that scored a touchdown on fewer than 20% of their drives in 2021.
Over the previous decade, 73.7% (104-of-141) of those teams came back the following season with an increased touchdown rate per drive, with those teams increasing that rate on average of 5.6% with 9.0 more offensive touchdowns per season.