The NFL’s latest offensive revolution has come from the adaptation of many successful college concepts but even the influx of college schemes hasn’t made projecting players from college to the NFL any easier. In some cases, the wide-open game of college football can make it more difficult to add context around the passing game. A 1,000-yard receiving season means a much different thing at Washington State than it does at a school where the ball is thrown less often, which is just about all of them.
Finding context for college receiving production isn’t anything new. We know metrics like target share and breakout age matter. So does when a receiver prospect declares for the draft.
But when looking at college production, not all things we assume at the NFL level hold true. In an NFL offense, where talent is more closely compacted than in college, earning a target is considered a skill. Good players get open and open players get the ball, therefore targets can be considered a production stat. That’s not necessarily the case for college receivers. Bad players get targeted because of few other options on an offense and in many cases, bad quarterbacks are throwing those targets. These are all things that need to be considered when looking into a college receiver’s performance.
One way we can try to do that is by contextualizing the receiver’s performance by his offensive surroundings to find out exactly what he added to his offense. We can do this by taking the receiver’s yards per target in his final college season and subtract the quarterback’s yards per attempt when the QB throws to anyone else. This helps account for a number of variables in the offense, including offensive quality, target share, and efficiency. It’s a metric I’ve used since 2014 and one I’ve called Target Yards Added, which is how we’ll refer to it going forward.
Here’s how the 2020 wide receiver draft class comes out by this measure:
2020 NFL Draft Target Yards Added
| Player | School | QB other-YPA | Targets | Target Share | YPT | Target Yards Added |
|---|---|---|---|---|---|---|
| Tee Higgins | Clemson | 7.59 | 91 | 17.95% | 12.82 | 5.23 |
| CeeDee Lamb | Oklahoma | 9.89 | 93 | 24.47% | 14.27 | 4.38 |
| Lawrence Cager | Georgia | 7.11 | 42 | 10.14% | 11.33 | 4.22 |
| Antonio Gibson | Memphis | 8.99 | 56 | 12.76% | 13.13 | 4.14 |
| Brandon Aiyuk | Arizona State | 7.35 | 104 | 27.23% | 11.46 | 4.11 |
| Quez Watkins | Southern Miss | 7.72 | 101 | 23.11% | 11.59 | 3.87 |
| Devin Duvernay | Texas | 6.97 | 129 | 27.51% | 10.78 | 3.81 |
| Omar Bayless | Arkansas State | 7.53 | 148 | 31.62% | 11.18 | 3.65 |
| Trishton Jackson | Syracuse | 6.19 | 107 | 26.23% | 9.56 | 3.37 |
| Marquez Callaway | Tennessee | 7.45 | 59 | 16.39% | 10.76 | 3.31 |
| Laviska Shenault | Colorado | 6.36 | 81 | 19.76% | 9.43 | 3.07 |
| Isaiah Hodgins | Oregon State | 6.40 | 123 | 29.36% | 9.42 | 3.03 |
| Henry Ruggs | Alabama | 10.55 | 55 | 13.55% | 13.56 | 3.01 |
| Tony Brown | Colorado | 6.42 | 75 | 18.29% | 9.43 | 3.01 |
| Jauan Jennings | Tennessee | 7.20 | 95 | 26.39% | 10.20 | 3.00 |
| John Hightower | Boise State | 7.33 | 92 | 19.87% | 10.25 | 2.92 |
| Antonio Gandy-Golden | Liberty | 7.71 | 141 | 31.19% | 10.00 | 2.29 |
| Cody White | Michigan State | 6.37 | 108 | 23.33% | 8.54 | 2.17 |
| Quintez Cephus | Wisconsin | 7.42 | 94 | 26.86% | 9.59 | 2.17 |
| Bryan Edwards | South Carolina | 5.21 | 111 | 23.87% | 7.35 | 2.14 |
| Chase Claypool | Notre Dame | 7.32 | 110 | 26.44% | 9.43 | 2.10 |
| KJ Hamler | Penn State | 7.32 | 96 | 26.16% | 9.42 | 2.10 |
| Binjimen Victor | Ohio State | 8.86 | 53 | 13.12% | 10.81 | 1.95 |
| Tyrie Cleveland | Florida | 8.26 | 35 | 7.51% | 10.03 | 1.77 |
| Collin Johnson | Texas | 7.81 | 59 | 12.58% | 9.47 | 1.66 |
| Jeff Thomas | Miami | 7.28 | 43 | 9.86% | 8.81 | 1.54 |
| Juwan Johnson | Oregon | 8.01 | 50 | 11.29% | 9.34 | 1.33 |
| Darrell Stewart | Michigan State | 6.63 | 88 | 19.01% | 7.92 | 1.29 |
| Van Jefferson | Florida | 8.21 | 70 | 15.02% | 9.39 | 1.17 |
| Justin Jefferson | LSU | 10.36 | 134 | 23.63% | 11.49 | 1.14 |
| Michael Pittman | USC | 8.22 | 138 | 26.85% | 9.24 | 1.02 |
| Denzel Mims | Baylor | 7.78 | 116 | 26.13% | 8.79 | 1.02 |
| Kalija Lipscomb | Vanderbilt | 5.21 | 82 | 21.52% | 6.16 | 0.94 |
| Tyler Johnson | Minnesota | 9.88 | 122 | 37.89% | 10.80 | 0.93 |
| Freddie Swain | Florida | 8.30 | 57 | 12.23% | 9.07 | 0.77 |
| Nick Westbrook | Indiana | 8.23 | 63 | 13.40% | 8.97 | 0.74 |
| Gabriel Davis | UCF | 8.85 | 132 | 28.88% | 9.40 | 0.55 |
| Jalen Reagor | TCU | 6.11 | 92 | 23.41% | 6.64 | 0.53 |
| Chris Finke | Notre Dame | 7.82 | 55 | 13.22% | 8.29 | 0.47 |
| Darnell Mooney | Tulane | 7.86 | 87 | 25.89% | 8.23 | 0.37 |
| Dezmon Patton | Washington State | 8.02 | 93 | 13.17% | 8.24 | 0.21 |
| Austin Mack | Ohio State | 9.10 | 39 | 9.65% | 9.26 | 0.15 |
| Lynn Bowden | Kentucky | 5.88 | 58 | 31.87% | 6.00 | 0.12 |
| Aaron Fuller | Washington | 7.74 | 92 | 22.44% | 7.63 | -0.11 |
| Quartney Davis | Texas A&M | 6.85 | 95 | 21.02% | 6.48 | -0.36 |
| Stephen Guidry | Miss State | 7.51 | 55 | 17.52% | 7.04 | -0.48 |
| Donovan Peoples-Jones | Michigan | 8.07 | 58 | 14.25% | 7.55 | -0.51 |
| Jerry Jeudy | Alabama | 11.10 | 110 | 27.09% | 10.57 | -0.53 |
| K.J. Hill | Ohio State | 9.26 | 75 | 18.56% | 8.48 | -0.78 |
| Kendrick Rodgers | Texas A&M | 6.88 | 58 | 12.83% | 6.05 | -0.82 |
| James Proche | SMU | 8.43 | 169 | 33.60% | 7.24 | -1.19 |
| K.J. Osborn | Miami | 7.67 | 85 | 19.50% | 6.44 | -1.23 |
| Joe Reed | Virginia | 7.52 | 111 | 21.39% | 6.12 | -1.40 |
| Isaiah Wright | Temple | 7.27 | 77 | 16.31% | 5.74 | -1.53 |
This isn’t a projection model or even a shortcut to a ranking system. Finishing among the top of Target Yards Added isn’t an automatic sign of a productive NFL career. But when tied in with scouting and other metrics, we can get a clearer version of a prospect’s profile.
For instance, we can take a look at Target Yards Added against something like Yards Per Route Run. Both measure a wide receiver’s efficiency, but in different aspects. Below is a chart of the 39 wide receiver prospects highlighted in the 2020 SIS Football Rookie Handbook by Target Yards Added and Yards Per Route Run.
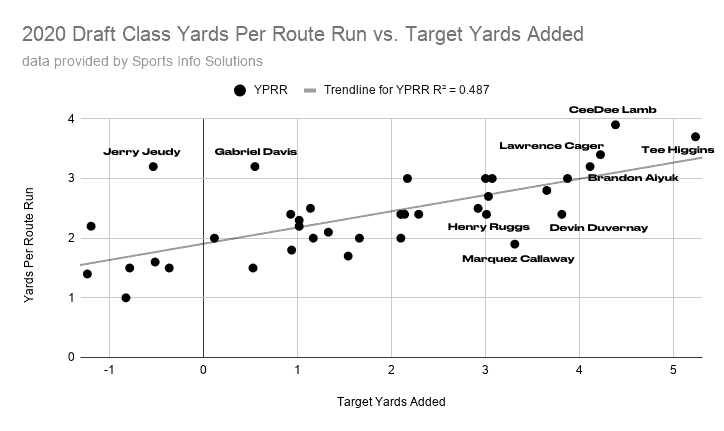
It’s interesting to see where these metrics agree and disagree with each other and the general consensus of these players. When they all agree, we get a pretty good look at some of the better prospects in the draft:
Finding The Standouts
Both Oklahoma's CeeDee Lamb and Clemson's Tee Higgins come out among the best in these metrics and are two of the more highly regarded receivers from the scouting side of things. Lamb is in the conversation as the best receiver in this class while Higgins has been perceived as more of a borderline first-round pick.
There are few questions that come from Lamb’s profile. He was among the top receivers in efficiency both on a per target and per route basis. He really is the one true outside No. 1 receiver in this class, which should make him the clear WR1.
Some have issues with Higgins’s athletic profile, but top-line speed is not a need for the position. Higgins was a top option in one of college football’s best offenses and his production was not hampered by the presence of Justyn Ross. Per SIS, Higgins also ran deep at one of the highest rates in the league at 55% of his routes, which falls short of just Tennessee’s Marquez Callaway (56%), who was almost exclusively a deep threat.
Alabama Wide Receivers
Looking at wide receiver production in this way might raise more questions about the Alabama receiving duo than it answers. Henry Ruggs is typically knocked because he did not have a high target share of raw production totals in the Crimson Tide offense. But by this lense, the Alabama offense was more productive when Ruggs was targeted.
The split between raw totals and per target rates somewhat resembles the situation between Terry McLaurin and Parris Campbell out of Ohio State last season. Campbell got a higher share of the targets (22.9% to 10.1%) and was perceived as the better prospect, but the offense was significantly better when McLaurin was targeted (5.9 TYA to 0.84).
Obviously, there are some differences but Ruggs’s ability to add to the offense should not be overlooked. Ruggs is also much more than the speedy deep threat he’s been pigeonholed as in some circles. Ruggs wasn’t even much of a “deep threat” with only 33% of his routes considered deep by SIS, which is below the class average. Still, Ruggs has the ability to use his speed in offense-changing ways, like taking a slant all the way to the house or using plus-route running and setting up cornerbacks playing off on comebacks down the sideline. He’ll earn more targets in the NFL.
Jerry Jeudy’s profile comes with a red flag with negative Target Yards Added. The most successful NFL prospect with negative TYA since 2014 is probably Ty Montgomery and he had to play running back for that to happen. Maybe you’re bullish Allen Lazard will breakout for the Packers or Hunter Renfrow will be a staple of the Raiders’ rotation. Typically, negative TYA is a writeoff for significant NFL production.
But even by this metric Jeudy has a similar defense case as Ruggs has with other metrics. The Alabama passing offense was quite good and he had to compete with three other NFL-caliber receivers. Among 276 draft-eligible receivers in this sample since 2014, only Marquise Brown last season had a quarterback with higher yards per attempt to other receivers than Jeudy did in 2019.
Later Round Options
Another use for this context can be to find potential late-round prospects who could exceed their draft capital. This class is already billed as one of the deepest we’ve seen in years with value to be had after the first round.
One player whose evaluation has been all over the place is Jauan Jennings of Tennessee. Jennings was successful as a big slot for the Vols last season (76% of routes from the slot) but had a terrible combine performance with a 4.72 40-time. Jennings’s game isn’t really predicated on speed and he has the ability to work defenders off the line to create needed separation. He also showed the ability to create separation late in routes and win down the field despite the lack of top-end speed. Jennings has positive marks in both TYA and YPRR as the go-to receiver in Tennessee last season.
There are also some deep threat options such as Jennings’s teammate Marquez Callaway, Boise State’s John Hightower, and Quez Watkins of Southern Miss, who were also plus-contributors to their offense on a per-target basis.