With the 2020 NFL schedule release scheduled for this Thursday night, we are taking a look back at how the schedules played out and impacted the fantasy landscape a year ago.
Yesterday we covered the strength of schedules and performances versus opponent for both quarterbacks and pass defenses. With the methodology laid out in the opening post, we are going to move on to the running back position and how defenses performed versus opposing backfields based on the points per game they were scoring and allowing entering that given week.
As a reminder, when it comes to defensive matchup analysis, I do believe a large portion of team defensive statistics are essentially statistics from the opposing offensive performance firsthand. Even with that thumbtacked in a front corner of my mind, I also do believe that there are good defenses in the NFL and that they can impact games. But when it comes down to how I incorporate defensive matchups into analysis and weekly decisions, I am more apt to shade towards a statistically poor defense elevating a mid-to-lower offense or player in a matchup versus a great defense erasing a great offense.
Without a baseline for points scored in Week 1 outside of the prior season statistics, those games both went into the player and team points averages allowed, but we are focusing on the subsequent games played Weeks 2-17 once we started applying 2019 output to the sample.
2019 Fantasy Strength of Schedule and RB Performance
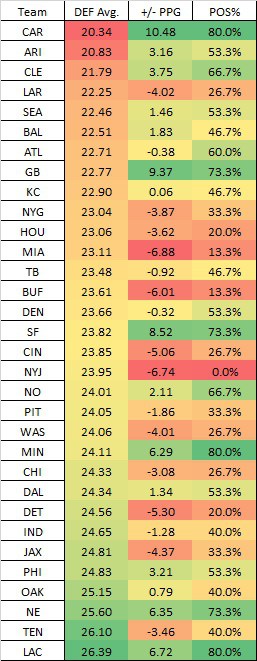
*DEF Avg. = Average PPR Fantasy Points allowed per game prior entering that matchup
*+/- PPG = On average how the Team Backfield scored per week vs. that prior DEF Avg.
*Positive % = Percentage of games in which the backfield outscored the prior DEF Avg.
- Christian McCaffrey provided the largest seasonal advantage for a RB1 ever in 2019. A feat that would be impressive under any circumstances. But he also did that while facing a slate of opposing defenses that were allowing the fewest amount of points per game to opposing backfields prior to facing the Panthers. Carolina had six games against top-six defenses in point differential allowed versus opponent and faced just two bottom-10 teams in that category. The Panthers led all teams by averaging 10.5 more collective PPR points as a backfield per game than their opponents had been allowing entering that game.
- Teams such as Arizona, Cleveland, and Seattle all were right behind the Panthers in facing a slate of opponents that had neutralized backfields, but all of those teams were also above water in outscoring their schedule and had above-average rates in amount of games in which they outscored the total their opponents were allowing coming into that week. The Rams were the only team in the top-six of schedule difficulty that struggled to produce points, ranking 26th in points scored versus their opponent average and 29th overall in points scored as backfield.
- On the other end of the spectrum, the Chargers faced defenses who on average were allowing the most points per game to backfields and the Los Angeles backfield was strong in outkicking the high output those teams were already allowing, ranking fourth in points scored above their opponents per week and first in overall team backfield scoring altogether. The team lost Melvin Gordon this offseason and are going through the transition of moving on from Philip Rivers. They still have Austin Ekeler, who just scored the second-most PPR receiving points for a running back ever in a single season. Whether there’s regression to be seen from Ekeler due to those changes and a potentially harder slate of opponents remains to be seen entering the 2020 season.
- No backfield scored fewer points last season than the Dolphins and they were a league-worst -6.9 points scored per game than what their opponents had been allowing prior to facing them. Ryan Fitzpatrick actually led the team with 243 rushing yards and their top back in yardage was Mark Walton with 201 yards on the ground.
- The Jets and Bills gave the Dolphins a run for their money, keeping things in the AFC East at the bottom of the barrel. The Jets ranked 31st in points scored per game average point differential while the Bills were 30th in each category. The Jets were the only team in the league last year in which their backfield failed to register even one game with more points scored than what their opponents had allowed per game coming into the matchup. For a team that faced Oakland, Jacksonville, Washington, Cincinnati, and Miami twice on the season, that is really saying something to how poor the situation was in terms of output from the New York backfield.
Of course, we have to flip the tables since a lot of defensive metrics are offensively influenced. With that in mind, we want to take a look at how defensive schedules played out and how those defenses performed versus their slate of opponents. Taking things to a team defense level, here is how 2019 shook out on that front.
2019 Defensive Fantasy Strength of Schedule and RB Performance
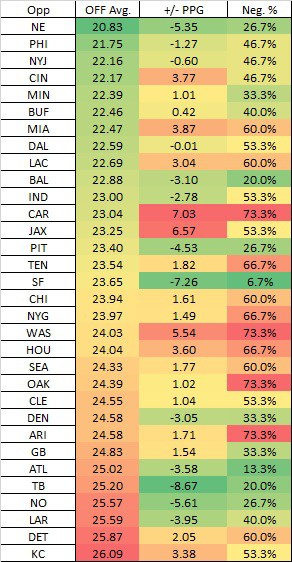
*OFF Avg. = Average team RB PPR Fantasy Points scored per game prior to facing the DEF
*+/- PPG = On average how the RBs scored per week vs. that prior OFF Avg.
*Negative % = Percentage of games in which the RBs failed to reach their season average prior to that point
- San Francisco allowed just one team (Arizona in Week 9) to match or best their seasonal average prior to that point, which led the league.
- No team had a lighter schedule of backfield opponents than the Patriots. Looking at how the rest of the AFC East performed above offensively, you can see the impact those six division games had in aiding that number and the Patriots allowed the fewest points per game allowed to opposing backfields (15.5). Even aided by schedule, New England was still strong in their performance, ranking fourth in points allowed versus what those teams were averaging entering their matchup.
- Two of the teams above New England in that category were the Saints and the Buccaneers, who ranked first and third in points allowed versus their opponent average despite facing the fourth and fifth highest-scoring schedules.
- Another team in the NFC South may be a little surprising given their stigma, Atlanta allowed the ninth-fewest points to backfields per game (21.4) in the sample despite facing the sixth highest-scoring slate. Just two teams (Houston and Arizona) scored more backfield points than they were averaging going into their matchup with the Falcons.
- While those three NFC South defenses were strong in limiting their opponents, the same can not be said for Carolina. As the good as the Panthers backfield was above opponents on the offensive side of the ball, they were equally as poor versus opposing backfields. Carolina allowed a league-high 7.0 fantasy points per game over what those teams were averaging prior to the matchup.
- Jacksonville was right behind Carolina, ranking 31st in points allowed over their opponent’s average coming in. The Jaguars defense allowed two of the three highest-scoring backfield games of the season in Week 5 versus Carolina (63.1 points) and Week 14 against the Chargers (59.6) while also allowing two other top-20 games to Atlanta in Week 16 (48.9 points) and the Colts in Week 11 (45.1).