

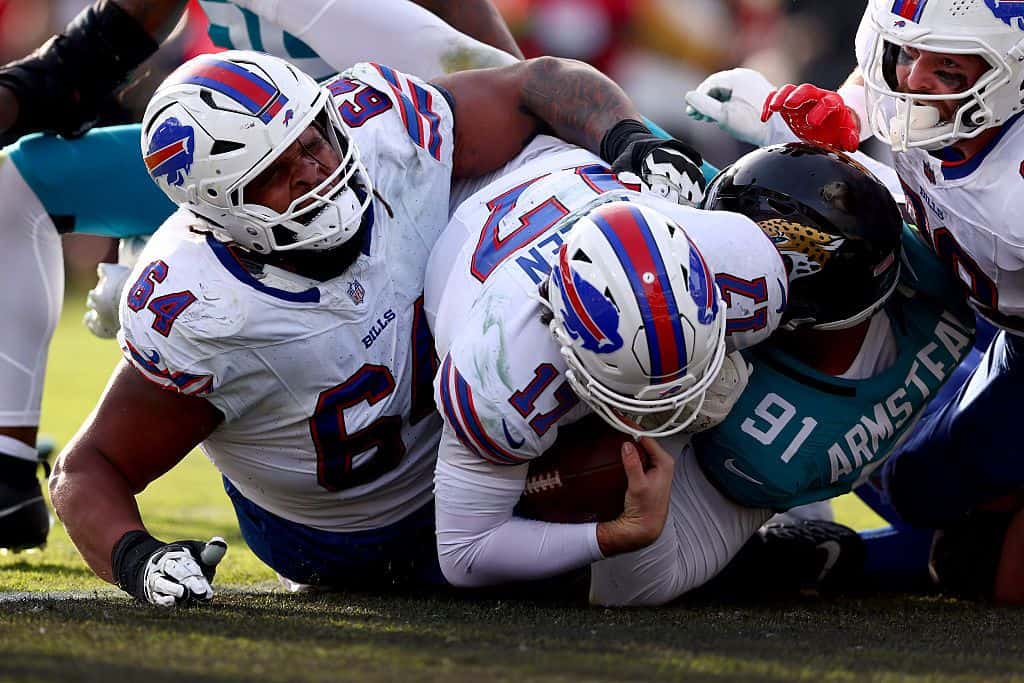
Every offseason, I break down the NFL offensive trends that will shape the upcoming season, including a deep dive into quarterback red-zone performance.

The goal for these articles is straightforward.

We are monitoring the league's current state to identify any outliers, which we can then incorporate into the upcoming season while also gauging league trends.

While we have already examined all the positional tiers for 2026, it is always beneficial to review the league's overall landscape.

Every NFL season is unique, so this is always a great way to lay some groundwork.

2026 Fantasy Football Odds & Trends
Draft Kit Hub
2026 League Trends
Quarterback Trends
Running Back Trends
Wide Receiver Trends
Tight End Trends
NFL Team Per Drive Trends
NFL Red Zone Trends
NFL Yardage to Touchdown Trends
Touchdown Trends
Red Zone Regression: Quarterbacks
Red Zone Regression: Running Backs
Red Zone Regression: Wide Receivers
Red Zone Regression: Tight Ends

Don't Miss Out on The Best Fantasy Football Coverage in the Business

Like the NFL, fantasy football never sleeps.

From rankings to the best draft strategies, Sharp Football has everything you need to get ready for the fantasy season in our Fantasy Football Draft Kit, powered by premier fantasy football analyst Rich Hribar.

Save more by bundling the Draft Kit with our in-season fantasy package that features Rich's comprehensive “Worksheet” preview of every game, every week of the NFL season.

Click here for more information about our fantasy coverage!

Red-Zone Fantasy Points Vs. Expectation

We are following up on our examination of league and team performance in the red zone last season and extending it to individual player analysis.

In that top-down team post, we covered not only how the majority of touchdowns scored in the NFL come from inside the red zone, but also that not all red-zone touches are created equal.

We also showcased in that post how NFL offenses have become more reliant on red-zone production as part of their scoring output.

The discovery of true regression candidates in this area of the field could prove pivotal, given the rising need for offenses to succeed in the red zone.

To reiterate some notes from that article that relate to passing production near the end zone since 2010:

  • 67.1% of all passing touchdowns come from inside the red zone. In 2025, that rate was 69.1%.
  • 43.8% of all passing touchdowns scored overall come from inside of the 10-yard line. In 2025, that rate was at 44.0%.
  • 22.7% of all passing touchdowns scored overall come from inside the 5-yard line. In 2025, that rate was 23.8%.

With that, the next step is to dive into red-zone production versus expectations for fantasy skill players, based on their actual opportunities and the sources of those opportunities.

2025 QB Red-Zone Fantasy Points Vs. Expectation

PlayerRZ FF PtsExp PtsDifference
Josh Allen148.7112.236.6
Trevor Lawrence153.7117.436.4
Jalen Hurts123.493.729.7
Brock Purdy91.967.924.0
Daniel Jones100.377.422.8
Jaxson Dart91.270.520.6
Matthew Stafford146.1128.018.0
Tyler Shough48.132.515.6
Tua Tagovailoa69.054.414.6
Jordan Love79.765.414.3
Patrick Mahomes115.2101.314.0
Kirk Cousins45.832.813.0
Jared Goff104.091.012.9
Drake Maye116.9104.512.4
Jacoby Brissett90.177.812.4
Michael Penix43.031.111.9
Joe Burrow59.048.011.0
Geno Smith66.658.87.8
Bo Nix105.898.67.3
Kyler Murray32.425.27.2
Baker Mayfield69.662.47.2
Shedeur Sanders19.914.65.2
Cam Ward66.461.84.6
Bryce Young76.772.24.5
Jayden Daniels35.431.04.5
Justin Herbert93.790.82.9
Lamar Jackson57.356.41.0
Malik Willis12.112.5-0.4
C.J. Stroud61.263.4-2.2
Sam Darnold66.471.5-5.1
Caleb Williams91.798.3-6.5
Aaron Rodgers72.181.6-9.5
Dak Prescott104.9125.9-21.1

Josh Allen 2026 Fantasy Outlook

If you have followed this series in previous seasons, one difference this year compared to last is that there are not as many top-heavy players here.

Last year, four quarterbacks scored 40 points above expectation.

Three were at 50-plus points, and Lamar Jackson (+89.9) set the record.

While not as wild at the top as last year, Josh Allen reliably sits near the front of the pack.

Josh Allen Red Zone Scoring

YearRZ PointsRankExp. PtsRank
2025148.72112.24
2024168.71109.55
2023192.61122.72
2022143.52119.73
2021173.91158.81
2020168.72130.91
2019115.1476.922

Just as we covered with Jahmyr Gibbs in the running back section, not all regression is something to run away from.

No player has had as large a fantasy presence in the red zone through the apex of Allen’s career.

Allen has consistently overperformed in the red zone, finishing as a top-five scorer in that area of the field in seven straight seasons.

While he has steadily produced more points in the red zone than expected, he has also ranked in the top five in expected points in five straight seasons.

Even if he does end up falling short of running as hot as previous seasons, he still is expected to be among the leaders in opportunities in that area of the field.

Buffalo has leaned more on Allen in the rushing game near the end zone after a lull in 2021 and 2022.

He led all quarterbacks last season in expected rushing points inside of the red zone (52.2) and was the most influential quarterback at the 1-yard line.

Josh Allen Fantasy Points Scored From the 1-Yard Line

YearFF PtsRankQB Rank
202540.631
202440.622
202330.543
20229.94918
202114.2259
202030.193
201932.531

Trevor Lawrence 2026 Fantasy Outlook

Trevor Lawrence led all quarterbacks in fantasy points scored inside the red zone last season and was third in expected points.

Lawrence ranked QB7 in expected passing points in the red zone and QB3 in expected rushing points, behind only Allen and Jalen Hurts.

He had the third-most dropbacks in the red zone (93) behind Matthew Stafford (108) and Dak Prescott (106) with the third-most passing touchdowns (22) behind Stafford (33) and Jared Goff (23).

As a runner, Lawrence had 23 attempts, which was third behind Allen (31) and Hurts (26), while his 9 rushing touchdowns in the red zone trailed only Allen (13).

Lawrence has not been as consistently above his expectation as Allen, which makes him more of a step of faith to operate at that high a level in 2026.

There are a few things to touch on surrounding that.

The first is that, outside the red zone, Lawrence was QB10 in scoring.

Jacksonville scored a league-high 110 points off takeaways last year.

They had a league-high 30 possessions start in the opponents’ territory, which led to 13 touchdowns (43.5%).

Lawrence himself accounted for 9 of those touchdowns (7 passing and 2 rushing).

He was second in the NFL in fantasy points scored on possessions that started in the opponents' territory (61.3) behind Travis Etienne (82.2).

On drives that started on their side of the field, the Jaguars ranked 18th in points per drive (2.01) and 12th in touchdown rate (23.9%).

After the bye, when the Jaguars had the best point differential in the NFL while ranking second in offensive points per game (31.2) and third in points per drive (2.81), they were 15th in yards per play (5.3) and 17th in yards per drive (30.9).

That said, I do believe gamers are pricing in regression for Lawrence this offseason.

On the other hand, we still have potential that Liam Coen understands the assignment.

In 2024, Baker Mayfield was third in points scored over expectation (+51.0) inside the red zone.

Jalen Hurts 2026 Fantasy Outlook

Jalen Hurts is still a factor near the end zone, ranking fourth in red zone scoring on QB9 expectations.

Even in a down year as a passer in a limited system, Hurts had a 32.7% touchdown rate in the red zone, which was third in the league.

That was a career high for him.

As a runner, he was still second in expected points.

The Tush Push was still effective last year, at least near the goal line.

Hurts converted 5 of 8 (62.5%) runs from the 1-yard line for scores last year, but he only had 8 of those attempts compared to 15 in 2024 and 13 in 2023.

The Eagles actually led the NFL in red-zone touchdown rate (70.5%), but the rub is that they did not get to the red zone as often in 2025 as in previous seasons.

Eagles Red-Zone Possessions With Jalen Hurts as Starter

YearRZ DrivesRZ TDRZ TD%
2025443170.45%
2024683957.35%
2023603660.00%
2022594067.80%
2021613862.30%

Philadelphia had 44 red-zone possessions last year, which ranked 28th in the league.

Outside of the red zone, Hurts was QB11 in scoring, so an increase of red-zone trips can elevate his top-down output in 2026.

Hurts also has a great immediate layout to create more scoring opportunities early in the season if things come together under Sean Mannion.

The Eagles open the season against the Commanders, Titans, Bears, Rams, Jaguars, Panthers, Cowboys, Commanders, and Giants before their Week 10 bye.

That is as good a schedule as an offense draws that deep into the season.

The downside is that, for as good as the Eagles' opening schedule is, a fantasy playoff schedule of the Seahawks in Week 15 and the Texans in Week 16 is as bad as it gets.

Hurts could always get into the end zone on the ground against those teams if they are producing red-zone trips, which is what we will need since expecting ceiling output against those opponents takes an extreme leap of faith.

Gamers will likely need those defenses banged up by the time we get to that point in the year.

Matthew Stafford 2026 Fantasy Outlook

Before even starting this exercise, I expected Matthew Stafford to be head and shoulders above the field in points relative to expectation.

Still, I was pleasantly surprised to find that he was not as much of an outlier.

The reason for that, compared to something such as touchdown rate, is that the Rams just had so many touchdown opportunities as a team.

He was seventh in points scored over expectation but was first in expected points scored.

The Rams did not have a huge outlier in dropback rate near the end zone last year.

Rams Dropback Rate in the Red Zone Under Sean McVay

YearRZ Dropback%Inside 10%Inside 5%
202555.9%51.9%44.2%
202448.8%50.6%37.8%
202351.2%51.1%45.0%
202261.3%63.8%53.6%
202160.2%60.7%65.9%
202040.8%28.9%34.0%
201948.7%37.7%34.4%
201852.6%46.0%30.6%
201751.2%43.5%35.5%

Stafford’s regression is largely the inverse of what we just covered with Hurts, being tied to the Rams naturally having fewer red-zone possessions in 2026.

In last week’s team trends, we covered that the 2025 Rams reached the red zone at the second-highest rate of drives for any team in the 2000s.

There will still be some efficiency regression here.

Stafford threw the ball 54 times into the end zone, completing 48.1% of those for touchdowns.

The league rate on end-zone passes converted to touchdowns was 37.4%.

His previous touchdown rates on end-zone throws with the Rams were 41.8% in 2021, 26.1% in 2022, 35.1% in 2023, and 28.6% in 2024.

That led to Stafford throwing 33 red-zone touchdown passes, the sixth-most in the 2000s.

This is where gamers are on top of things with Stafford's price this offseason, arguably too low.

Dak Prescott 2026 Fantasy Outlook

To this point, we have covered some of the top players who have exceeded expectations.

Dak Prescott was at the bottom, with the most points scored below expectation last year.

Both CeeDee Lamb and George Pickens were underachievers in the receiver section, so it is not a surprise that Prescott was tied to their underperformance.

He was still fine for fantasy because of the top-down volume the Cowboys had, but there was the potential for Prescott to have an enormous campaign last season.

Prescott was the QB2 in expected points in the red zone, finishing QB8 in actual points scored.

Where Prescott got hurt was with a 32.7% touchdown rate on throws into the end zone, which was 28th in the league.

That was his lowest rate since 2019.

As a result, his 21.2% red-zone touchdown rate was his lowest since 2018.

Caleb Williams 2026 Fantasy Outlook

Caleb Williams is the other noteworthy name here below the fold.

Williams was the QB13 in red-zone scoring on QB8 expectations.

Williams had a 19.4% touchdown rate in the red zone, ahead of only Aaron Rodgers (18.9%) and Bo Nix (18.8%).

On red-zone throws into the end zone, Williams completed 35.5% (11 of 31), ahead of only J.J. McCarthy (33.3%), Sam Darnold (32.1%), and Jaxson Dart (21.7%).

The growth under Ben Johnson was there for Williams in Year 2, providing the foundation for another large step in Year 3 if he can push to league rates in scoring opportunities as a passer.

Daniel Jones 2026 Fantasy Outlook

Going back to a player near the front, it was not surprising to see Daniel Jones there, as he was on track to have his best season in the league before his injury.

Daniel Jones Red-Zone Scoring

YearRZ FF PtsExp PtsDifference
2025100.377.422.8
202438.052.6-14.6
202317.617.60.0
202296.975.721.2
202139.657.4-17.8
202032.455.8-23.5
201970.662.77.9

Last year was only the third time that Jones was above expectation.

While his own inherent volatility is something to account for, there are a few other things that make it uneasy to buy into Jones rolling over his 2025 output.

The first is the Colts made several appearances last week in our team regression series as a team to be wary of.

Primarily in the per-drive, red-zone, and yardage-into-touchdowns pieces.

50% of Jones’s red-zone throws into the end zone resulted in touchdowns, the highest rate of his career.

His previous high was 40%.

The second area of concern is his Achilles injury.

Jones was the QB5 in expected rushing points in the red zone and the QB7 in actual rushing points in that area of the field.

On par with the theme for the guys with regression expectations, Jones fully has all of this priced in this offseason.

And just as with Lawrence and Stafford, you can make an even stronger case that it's overpriced here.

Jaxson Dart 2026 Fantasy Outlook

I do want to touch on Jaxson Dart because he has not been as valued this offseason as his ceiling showcased, even by myself.

In 12 games as a starter, Dart had three top-three scoring weeks as a starter, with five top-six weeks and eight top-10 weeks.

Dart did overachieve in the red zone, ranking sixth in points over expectations.

He did that on the strength of rushing, ranking fourth in actual and expected rushing points on only 83% of the offensive snaps.

As noted with Hurts, the rushing guys have added out in the red zone, and the quarterbacks are still producing a high rate of the league’s rushing touchdowns.

But that rushing component is more about Dart’s floor.

His ceiling potential comes from the marriage of passing output and rushing.

As a passer, there is plenty of room for him to raise that tide.

Last season, Dart completed a league-low 21.7% of his red-zone passes into the end zone.

The base rate was 41.7%.

Dart was middle of the pack in off-target rate on those throws at 17.4% (15th) with a 4% drop rate (11th).

Even if Dart can get to baseline levels of passing efficiency near the end zone, his stock goes way up.

If Malik Nabers is back earlier than expected and the other additions to the offense are better than advertised, then there is added ceiling.

Justin Herbert 2026 Fantasy Outlook

I also want to take a window to talk about Justin Herbert.

Herbert was not glaringly bad versus expectations in the red zone last season, but there is plenty of meat on the bone for improvement in 2026.

Herbert completed only 50.6% of his passes in the red zone last year, which ranked 28th in the league.

He had a league-high 5.2% interception rate in the red zone.

The Chargers were 29th in red-zone touchdown rate (47.4%) and 19th in goal-to-go touchdown rate (70.8%), which we covered as a reason to be more bullish on them heading into 2026.

Over four years with Mike McDaniel in Miami, Tua Tagovailoa completed 64.9% of his red-zone passes (3rd) and posted a 28% touchdown rate (4th).

Over his tenure in Miami, McDaniel’s offenses scored on 59.8% of their red-zone possessions (7th) and 76.3% of their goal-to-go possessions (7th).

Tyler Shough 2026 Fantasy Outlook

I am going to close this up on a player who was good in the red zone last season.

Tyler Shough led the NFL in red-zone touchdown rate (41.2%) and was third in completion percentage (71.4%).

That was against a lighter schedule of opponents, but also as a rookie, with arguably one of the worst supporting casts in the NFL due to injuries to the offensive line, running back, and wide receiver.

Shough was also the QB7 in red-zone rushing points during his weeks as the starter.

The problem, overall, was that the Saints did not have enough red-zone opportunities.

In his weeks as the starter, Shough only had 23 total dropbacks in the red zone, which ranked 28th in the league.

The Saints were a regular-appearing team last week in our regression series on having more scoring opportunities in 2026 than last season.

If that happens and Shough remains as efficient in the red zone as he was as a rookie, then lift off.

Even if he comes closer to the pack in terms of efficiency due to sample size, there is an added upside to having more opportunities in that area of the field, which smooths out any decline.