- Why using the entire red zone is a lie
- What 2018 red zone stats can we use in 2019?
- Which teams will score more in the red zone in 2019?
Make sure you don’t miss any part of our fantasy football draft prep by checking out our fantasy football draft kit, which will feature all of Rich Hribar’s articles, rankings, and a printable cheat sheet
![]()
After we took a look at team production per drive and scoring and play calling, the next step is to take a look at team production where the fantasy sauce is truly made…the red zone.
The red zone is vital because that is where fantasy football money is made. They even dedicated an entire channel for you to watch on Sundays so you could see your players as their teams near the opponents’ end zone. 72.5 percent of all offensive touchdowns over the past 20 years have come from inside of the red zone. That number was at 74.2 percent in 2018. We all love big plays, but the bulk of offensive scores is coming from one sector of the field. The tricky part of red zone analysis is that it's often presented as if arbitrarily crossing the 20-yard line is the Holy Grail of touchdowns when it’s still no secret that the closer a team gets to the end zone, the more likely the team is to put the ball in the end zone.

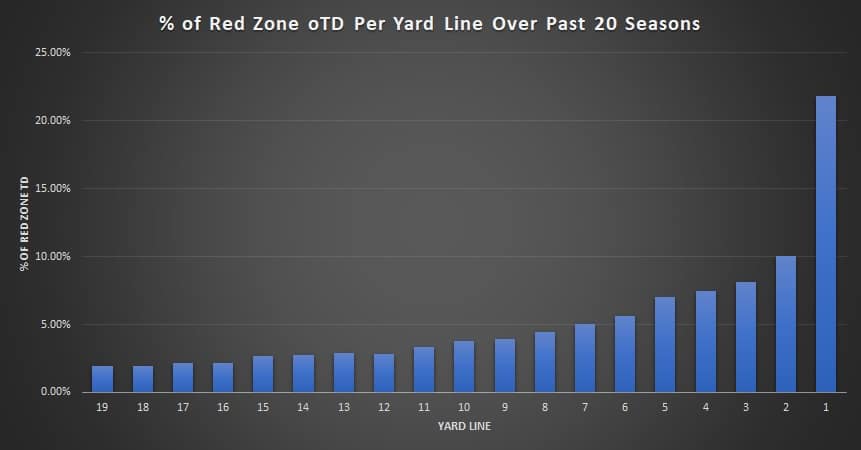
Over half (53.2 percent) of all offensive touchdowns scored across the league over that span come from inside of the 10-yard line. 54.5 percent of all red zone scores come from the 5-yard line and in. In the opening scoring article, we showed how 2017 touchdown production fell off a cliff, but it bounced right back and then some last season by a spike in offensive play volume near the end zone. There were 116 more offensive plays run across the league inside of the 5-yard line in 2018 than there were in 2017, resulting in a spike of 61 offensive touchdowns just from that area of the field compared to the year prior.
That’s just covering four yards of the field, but 31.9 percent of all red zone scores come from just the 1-2 yard lines. Given the addition of automatic spots for defensive penalties in the end zone, it’s not a surprise to see the 1-yard line hold the main spot for touchdown production, but the gap it has over the field is staggering, holding double the value of the next yard marker on the field. Over the play-calling sample from above, more offensive touchdowns were scored from the 1-yard line than the 12-19 yard lines combined. Last season, 16 percent of all offensive touchdowns were scored from the 1-yard line while accounting for 21.6 of all red-zone touchdowns.
Not all plays are equal on the football field and that goes double for the red zone. The closer a team is are, the better odds a team has to score.

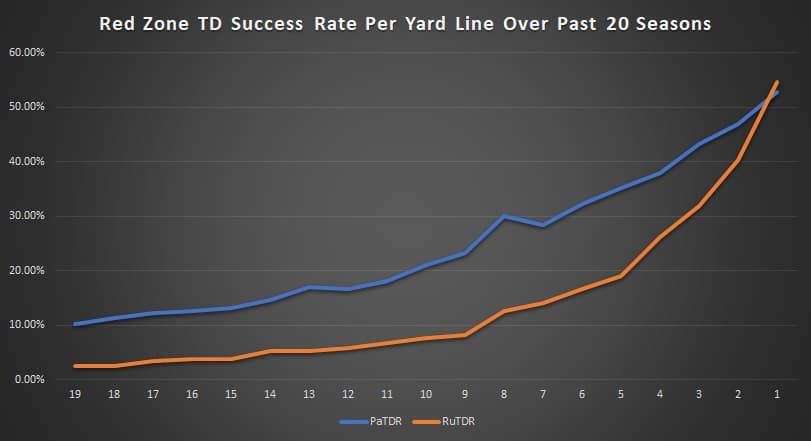
Just like anywhere else on the field, throwing the ball in the red zone is going to have heightened success over running it when looking at scoring production. Well, until you get to the 1-yard line. The rate of rushing touchdown output per play doesn’t hit 25 percent until you get inside of the 5-yard line while passing marks stay right around 30 percent from eight yards and out. A pass from three yards out has more than double the touchdown success rate as one from 10 yards out, while the 10-yard line has more than double the touchdown success of one coming from 19-yards out. I’ll be covering more of this on an individual player level throughout the week, but this is often the misconception of the actual value of a player's red zone opportunities, all else being equal. Sure, Cooper Kupp may have had a solid volume of red zone targets (11) while he was active last season, but when just three of those came from inside of the 10-yard line, there’s an entirely new context to his true scoring opportunities. If getting inside of the 20-yard line is the red zone, then the 10-yard line is the green zone, and the 5-yard line is the gold zone.
Team Correlations
The other delicate part about red zone analysis from the predictive level is that year-over-year red zone scoring opportunities aren’t exactly the stickiest.
The way to read this is that just 14.1 percent of the following season’s red zone opportunity for a team can be explained by their previous-year total and so on across the table. We’ll cover individual player correlations in the next post, but on a team level these drive opportunities, play volume, and scoring rates have an enormous amount of yearly variance. Scoring touchdowns is more about opportunity than anything else. You shouldn’t take too much stock in adjusting your outlook on players solely based on spikes and lulls in the red zone and we’re going to cover a few of those outliers from the 2018 season here.
Teams That Needed a Red Zone GPS
The Arizona Cardinals reached the red zone on just 15.8 percent of their possessions. That mark was not only the lowest in the league, but the lowest for a team since the 2014 season and the third-lowest rate for any team over the past decade behind the Oakland Raiders in 2009 and 2014. We’ve spent a lot of space on the Cardinals’ offensive ineptitude so far, so we won’t dwell there, but here are the other teams that joined them in a depressed rate of finding the red zone.
| Team | RZ Opp/Gm | RZ Drives | TotDrives | RZ% |
|---|---|---|---|---|
| Arizona | 1.8 | 29 | 182 | 15.80% |
| Miami | 1.9 | 30 | 176 | 17.30% |
| Jacksonville | 2.1 | 34 | 177 | 18.90% |
| Buffalo | 2.3 | 37 | 188 | 19.60% |
For as good as overall scoring was across the league in 2018, these four teams reached the red zone on fewer than 20 percent of their possessions, the most teams to do so in a single season since the 2011 campaign.
The Dolphins were something special. Miami ran just 77 offensive plays in the red zone, the fewest by a team since the 2005 season. They ran just 29 snaps inside of the 10-yard line — the fewest since 2012 — and most amazingly of all, they ran just SEVEN total plays inside of the 5-yard line all season long. That total matched the fewest plays run by a team inside of the 5-yard line since the data was tracked in 1999.
While we’re certainly not placing the offenses listed here to jump among the pantheon of the league, they are all good blind bets on increasing scoring production, which impacts projections and player value in drafts. Over the previous decade, there were 26 other teams that failed to reach the red zone on 20 percent of their possessions. Of those teams, 25 increased that rate the following season with an increase on average of 8.2 percent and 10 offensive red zone touchdowns the following season.
On the other end of the spectrum, the Saints ran 204 red zone plays last season, which has only been bested by three times (all by various Patriots teams). On top of that play volume, they got to gold zone — inside of the 5-yard line — more than anyone else, leading the league with 54 snaps inside of the five, the most by a team since the record-setting 2013 Broncos offense and sixth-most over the past decade. They didn’t waste those opportunities, either, producing 26 offensive scores from that gold zone, tied for the second-highest mark over the past decade behind the 2012 Patriots. We undoubtedly anticipate the Saints being a productive fantasy offense once again this season given their track record, but their scoring rate per drive and amount of short-scoring opportunities should regress from their 2018 totals. Those teams above the Saints in plays run inside of the 5-yard line went on to lose an average of 7.6 offensive touchdowns from that area of the field the following season with an average loss of 17 offensive snaps run.
Rate of Red Zone Scoring
Reaching the red zone is one thing but converting those trips into touchdowns is another. Given the 2018 season produced the most touchdowns in league history, it’s not surprising the league rate of converting 58.6 percent of all red zone opportunities into touchdowns was also a new high for the league.
At the top in creating that high level of efficiency, we had six teams convert over two-thirds of their red zone possessions into touchdowns — the most ever in a season — while three teams converted those possessions into touchdowns at over a 70 percent rate.
| Team | Year | RZ Opp/Gm | RZTD/Gm | RZTD% |
|---|---|---|---|---|
| Pittsburgh | 2018 | 3.1 | 2.2 | 73.50% |
| Kansas City | 2018 | 4.3 | 3.2 | 73.10% |
| Cincinnati | 2018 | 2.8 | 2 | 71.10% |
There were only eight other teams over the previous 20 seasons to turn in a touchdown rate as high as three teams did in the red zone last season. The Chiefs should be a fairly obvious team to appear here since they were arguably the best offense we’ve ever had in a single season in terms of scoring and efficiency. 29.8 percent of all the Chiefs’ red zone plays resulted in a touchdown last season, which was the third-highest rate of the past decade. The league rate outside of Kansas City was 21.6 percent.
Behind them was a surprise. Most people would likely be shocked the Bengals were so efficient at producing touchdowns given their offensive injuries a year ago, but the Bengals scored a touchdown on 29.1 percent of their red zone plays — which only trailed the Chiefs — despite ranking 25th in the league in overall red zone play volume.
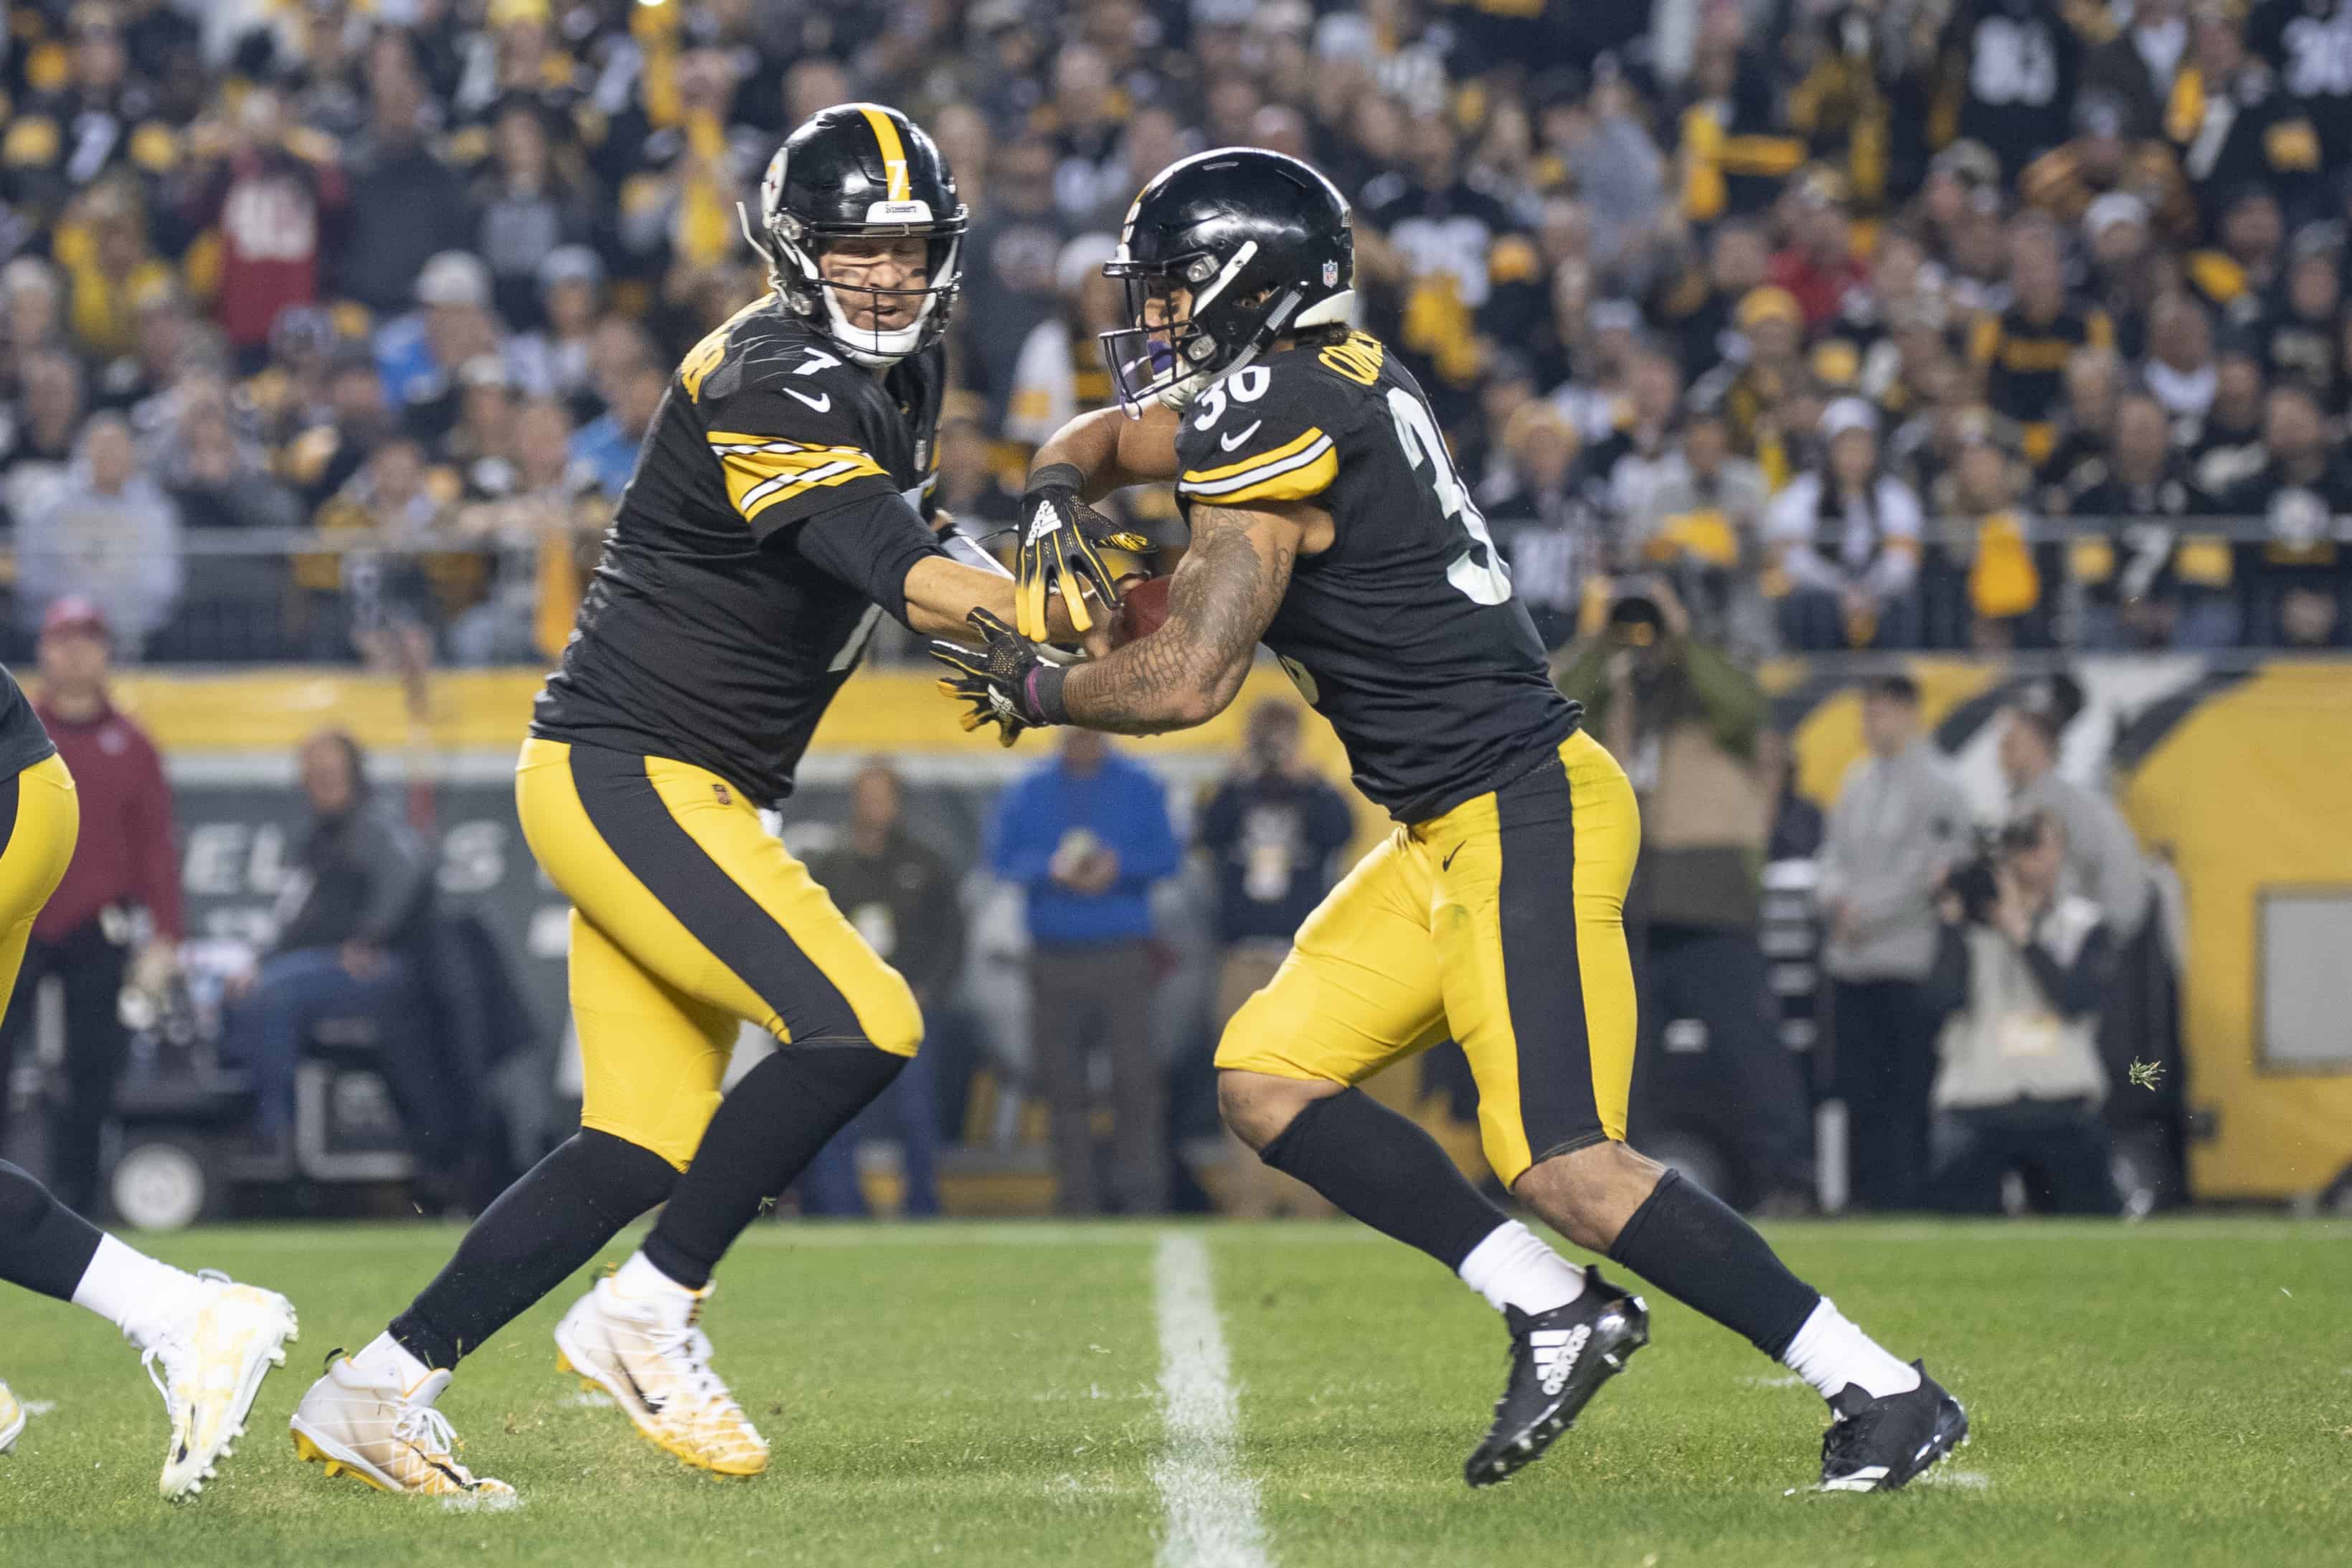
The Steelers are also not a surprise, but given their success, you can get a good gauge what was able to propel James Conner to score more touchdowns (13) in a season than Le’Veon Bell ever did in a single season. The Steelers ran 44 plays inside the 5-yard line last season, their most in a season since the 1999 campaign. Despite missing three entire games, Conner still ranked fourth in the NFL in touches (15) inside the five while matching the league-lead with nine rushing touchdowns from that area of the field. Bell’s touch totals inside of the five the past four seasons were eight, six, three and eight.
That’s just an example of how the variance in opportunities per area of the field can impact fantasy football. Of those previous eight teams to convert their red zone opportunities into touchdowns at a rate like these three teams did, the following season those teams suffered an 11.5 percent decrease in red zone conversion rate with an average loss of 5.6 red zone touchdowns per season.
| Team | Year | RZ Opp/Gm | RZTD/GM | RZTD% |
|---|---|---|---|---|
| San Francisco | 2018 | 3.2 | 1.3 | 41.20% |
| Jacksonville | 2018 | 2.1 | 0.9 | 44.10% |
| NY Jets | 2018 | 2.8 | 1.2 | 44.40% |
On the other end of the spectrum, we had three teams that converted fewer than half of their red zone possessions for scores a year ago. The 49ers popped up as a team that we already objectively signaled to have more rushing touchdowns this upcoming season, and you can see where they were injured in that regard a year ago. This also plays right into the early analysis we did on the Jaguars being a team that should be expected to rebound in the touchdown department this upcoming season.
The Jets are a team that hasn’t popped up for us yet, but they struggled to finish drives in Sam Darnold’s rookie season, which was a major problem since they already ranked 24th in those opportunities per game. The only teams that scored fewer red zone touchdowns than the Jets were the Cardinals, Dolphins, and Jaguars.
We have a much larger sample size of teams falling being the red zone Mendoza line of scoring on fewer than half of their red zone possessions. Over the past 10 seasons, 85 other teams fell into that bucket and for context on how much positive touchdown recoil we had a year ago, there were nine teams in this bucket from the 2017 season. 72 of those 85 teams improved on their red zone touchdown rate the following season with an average increase of 11.4 percent while seeing an average increase of eight red zone touchdowns.


