- NFL Use of Running Backs in the passing game is larger than ever
- Having an elite Running Back is the biggest edge in fantasy football
- You have to pay to land an elite back in fantasy
Make sure you don’t miss any part of our fantasy football draft prep by checking out our fantasy football draft kit, which will feature all of Rich Hribar’s articles, rankings, and a printable cheat sheet
![]()
After focusing on the tight end position from a top-down view, scoring correlations and player archetypes and our rankings and draft plans, we’re moving our focus over to the running back position this week. Taking a similar track, the first thing we’re going to look at is the leaguewide use of the position over the past decade.
League Running Back Usage Over the Past 10 Seasons
| Year | Touches | RuAtt | TGT | Rec | St. FF Pts | PPR Pts. | Lg. Tch% |
|---|---|---|---|---|---|---|---|
| 2009 | 14854 | 12427 | 3348 | 2427 | 9789.3 | 12216.3 | 60.70% |
| 2010 | 14630 | 12166 | 3354 | 2464 | 9339.5 | 11803.5 | 59.90% |
| 2011 | 14471 | 12075 | 3327 | 2396 | 9344.1 | 11740.1 | 59.20% |
| 2012 | 14366 | 12057 | 3183 | 2309 | 9109.8 | 11418.8 | 58.00% |
| 2013 | 14507 | 11922 | 3518 | 2585 | 9306.2 | 11891.2 | 58.10% |
| 2014 | 14243 | 11723 | 3452 | 2520 | 9253.4 | 11773.4 | 57.20% |
| 2015 | 14278 | 11581 | 3634 | 2697 | 9230.5 | 11927.5 | 57.10% |
| 2016 | 13989 | 11456 | 3394 | 2533 | 9428.4 | 11961.4 | 56.30% |
| 2017 | 14507 | 11751 | 3710 | 2756 | 9325.6 | 12081.6 | 58.90% |
| 2018 | 13709 | 10959 | 3624 | 2750 | 9713.7 | 12463.7 | 55.40% |
The first thing that jumps out here is that the league is actually using the running back position less in the overall touch department and in terms of leaguewide rate of touches, but they have gotten smarter by replacing empty-calorie rushing touches with receiving game opportunities. Running back targets and receptions have risen exponentially since 10 years ago and have really taken off in three of the past four seasons. Because of that, the position as a whole was able to post its highest-scoring fantasy season in either scoring format since 2009 despite receiving its lowest percentage of leaguewide touches and fewest amount of overall touches over the past 10 seasons. A receiving target carries 2.5 times more fantasy value than a rushing attempt in PPR formats while it holds a 1.3 times edge in standard scoring.
Near the end zone, passing opportunities have exploded of late as running backs have caught over 100 receiving touchdowns in four of the past five seasons after averaging 74 collective receiving scores per season over the previous five seasons. Running backs caught 118 touchdown passes last season, their most in a season ever.
We talked briefly about how the impact of the increased passing use for running backs has stunted the fantasy growth for tight ends and that comes more to life when you realize running backs have accounted for 906 more receptions than tight ends over the past two seasons. Backs are vacuuming up short-yardage targets now more than ever. Last season, nine different running backs accounted for at least 15 percent of their total team targets while four — Christian McCaffrey, James White, Saquon Barkley, and Alvin Kamara — had over 20 percent of their team passing opportunities.
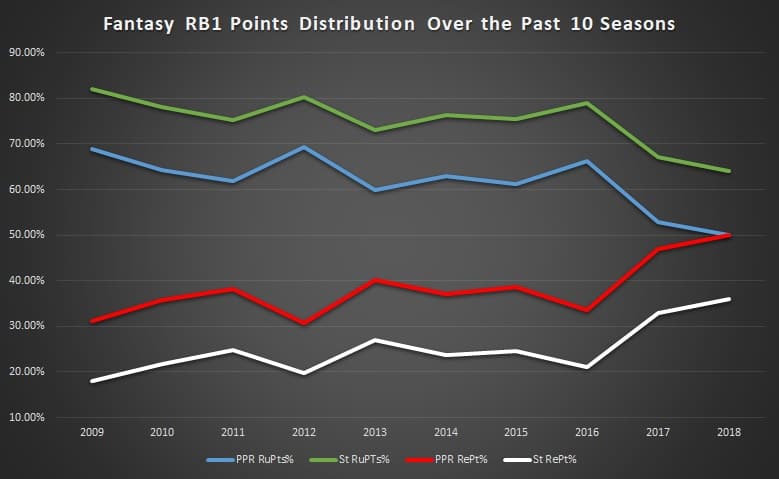
The top of the position in terms of fantasy output is where we’ve seen the largest growth within the running back group. Take a look at the receiving output produced by the RB1 groups over the past decade.
| Year | PPR RB1 Rec. | PPR ReYd | PPR ReTD | St RB1 Rec. | St. ReYd | St. ReTD |
|---|---|---|---|---|---|---|
| 2018 | 797 | 7027 | 49 | 761 | 6543 | 45 |
| 2017 | 733 | 6329 | 33 | 634 | 5324 | 28 |
| 2016 | 532 | 4555 | 24 | 532 | 4555 | 24 |
| 2015 | 524 | 4574 | 20 | 509 | 4340 | 21 |
| 2014 | 576 | 4889 | 29 | 570 | 4722 | 28 |
| 2013 | 628 | 5311 | 33 | 578 | 4895 | 28 |
| 2012 | 500 | 3960 | 19 | 431 | 3344 | 12 |
| 2011 | 589 | 5214 | 22 | 515 | 4559 | 22 |
| 2010 | 607 | 5201 | 18 | 573 | 4903 | 18 |
| 2009 | 545 | 4366 | 13 | 506 | 4034 | 14 |
With that spike in receiving usage, PPR RB1 scorers (top-12 for a season) had 47 and 50 percent of their fantasy points come directly from receiving output after they averaged 35.7 percent of their scoring stem from receiving over the previous eight seasons. In standard leagues, those marks have been at 32.9 percent and 35.9 percent over the past two seasons after 22.6 percent on average prior.
This is why investing in the running back position has still remained a constant for fantasy purposes and why running backs still dominate draft capital in the early rounds of fantasy drafts.
What makes the top of the position so valuable when using up your highest draft capital in relation to a deeper and more linear position such as wide receiver is the individual players making up the high-end fantasy running backs have a shorter supply and are in higher demand.
With the top of the position being so heavily elevated through receiving, we’ve seen larger and larger gaps in RB1 to RB2 to RB3 scoring occur. The RB1 group has outscored the RB2 group by 1,042.1 points, 1,122.4 points, and 1,328.9 PPR points over the past three seasons.
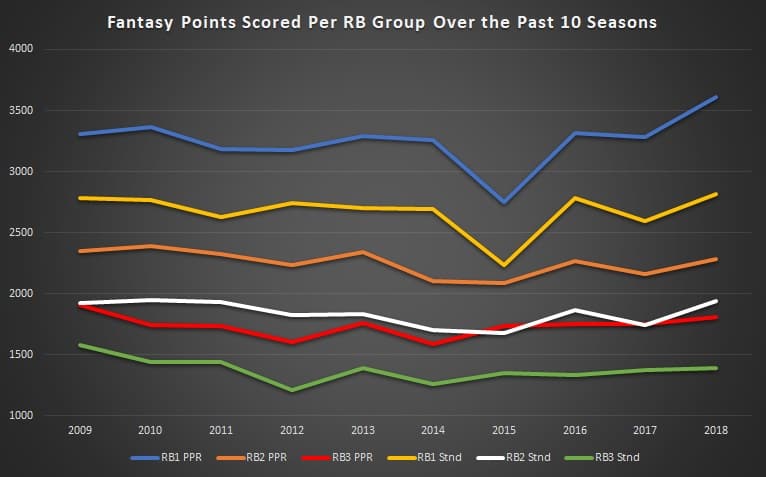
Over the past 10 seasons, the RB2 fantasy group on average has only produced 69.4 percent of the scoring output generated by the RB1 group in PPR formats. In each of the past three seasons, that number has been significantly lowered, with the secondary group producing just 63.2 percent of the RB1 scoring a year ago. Compare that to the wide receiver position, which had the WR2 output average 76.3 percent of the WR1 output over that same time span and was at 71.3 percent in 2018, and there’s a clear edge in having an RB1 over the field than having a WR1.
Going even further, fantasy backs with an RB3 (RB25-36) seasonal finish have averaged just 53.6 percent of the RB1 output (50.1 percent in 2018) and 77.2 percent of the RB2 output (79.3 percent in 2018) while the WR3 grouping has averaged 63.5 percent of the WR1 output (58.7 percent in 2018) and 82.8 percent of the WR2 output (82.4 percent in 2018) over the past 10 years.
These, of course, are arbitrary baseline cutoffs contingent on bulk numbers over weekly viability, but while there are individual conversations to be had for each player you’re considering selecting at a specific spot in your drafts, there are just more viable fantasy players in a given season at the wide receiver position than the running back one in relation to the performance of the top scorers of the position.
This is the lowest hanging branch of reasoning why the best running backs dominate early draft capital despite holding higher injury and flat-out bust rates than early-round wide receivers. The fact is that average fantasy play from a wide receiver is more functional than average running back play for fantasy purposes. This also holds true on the weekly level. In fact, even the weekly WR4 group is more viable in relation to the top of their respective position than the RB3 group. Those are the bodies who will be operating in your FLEX positions more often than not in leagues that have them.
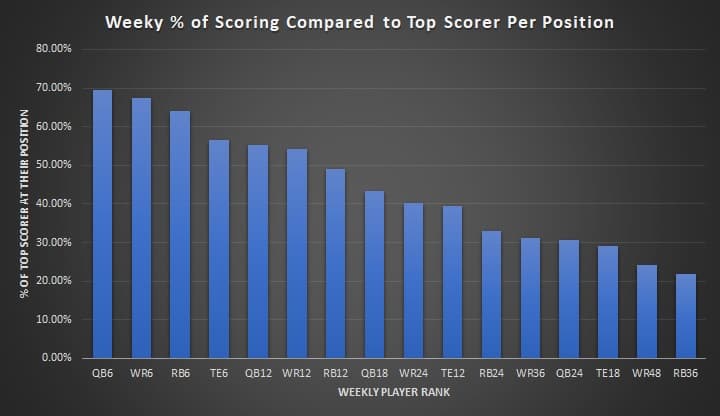
Looking at weekly scoring over the past five seasons, running back is ahead of only tight end in terms of the gap between the highest scorer at the position and the positional baselines that create roster allocation to starting lineup requirements. Factoring in those requirements means that having a consistently high-scoring running back is still the biggest edge you can have in fantasy football on the weekly and seasonal level.
Of course, selecting those correct players is still easier said than done. We’re better at setting that market for running backs over tight ends, but in totality, we’re still not amazing in that area.
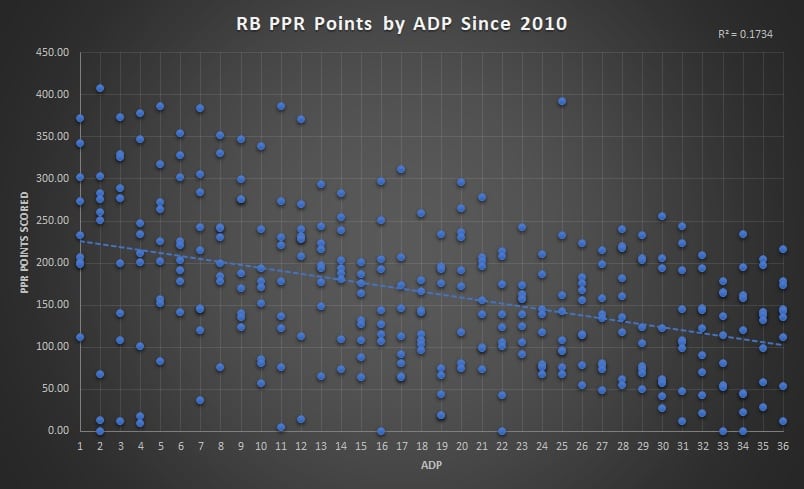
Even though we’re leaving the door open to get a ton of binary player choices incorrect, the one thing that is still evident here is you largely still have to pay to play at the running back spot. Of the 25 300-plus-point seasons from top-36 selected running backs over this span, only two came from running backs selected outside of the top-12 at the position while 15 of them were produced by players with a top-six ADP at the position. This is what makes opening drafts by up going WR-WR in the opening two rounds a tougher proposition if your goal is to land one of those true difference makers that we highlighted above even though wide receiver is a safer position in terms of injury and bust rates. You can still win fantasy leagues without an apex running back, but having one makes the life of winning seasonal games easier.
In terms of expected points per draft slot, the steep decline hits at RB15. That entire secondary bucket of mid-to-late RB2 options has been the largest minefield over the sample above. The difference in average expected points per player for RB15-24 compared to the RB3 group (RB25-36) is only 16.4 points, but that RB15-24 carries a difference of 66.1 points on average from the running backs above (RB1-14) in expected points per player.
If you’re looking at players disappointing per draft slot, that’s also the hottest pocket of failure. That same mid-to-late RB2 group has held a 53.3 percent bust rate — players who finished 12 slots lower than their draft selection — while the RB3 group is at 51.1 percent. The other difference is the success rates of each group. That same RB2 group had just 15.6 percent of their players jump up to RB1 status, while the RB3 group had 31.5 percent of their bucket jump up to RB2 or better status with 10.2 percent leaping all the way up to RB1 output. It’s not much of a revelation to suggest it is easier for an RB3 selection to maintain their RB3 status and outproduce their cost to RB2-plus levels than it has been for that RB15-24 grouping of backs in terms of success and failure rates, but it does illuminate just how much their margin for failure is tighter while their success rates haven’t been strong. Avoiding that bin of mid-to-late RB2 backs while loading up with multiple swings on the RB3 or later group can be just as fruitful.
Running Back Age: Nothing But a Number?
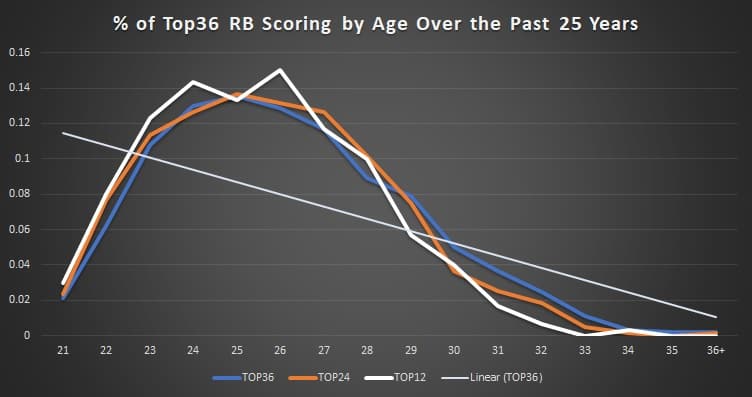
While the running back position has just recently become one influenced by receiving usage, it’s always been one about early-career player arcs paying off the most for fantasy purposes. The position itself has had a major influx of young talent over the past few seasons with 33 of the top 36 scorers last season coming from players 27 years old or younger while 25 of the top top-36 scorers were at age-25 or younger. Looking at the top of the position — those players we’ve established as having the highest fantasy relevancy — and just six of the 36 RB1-scoring seasons over the past three years have been produced by backs at age-28 or older. The league is about chewing backs up and spitting them out — well, unless you are immortal like Frank Gore. Just 12 running backs/fullbacks rostered last season across the league were 30 years old or older while 80 percent of the position rostered was made up of players at age-27 or younger. If you look at current ADP, you have to go all the way down to the RB22 (Mark Ingram) to find the first back entering the 2019 season at age-28 or older while only two other backs (Lamar Miller and Latavius Murray) are in that bucket for running backs holding a top-36 ADP currently this summer. You have to get all the way down to LeSean McCoy (ADP of RB37) to find the first back that has already hit 30-years of age.