- Which stats matter the most for Tight Ends?
- Why pass routes are more important than snaps
- Which Tight Ends relied on catches, yardage or TDs the most
Make sure you don’t miss any part of our fantasy football draft prep by checking out our fantasy football draft kit, which will feature all of Rich Hribar’s articles, rankings, and a printable cheat sheet
![]()
In our opening post on the tight end position, we took a top-down view of the position in bulk for fantasy. In the follow-up, we’re going to get into a little more individual player content by exploring archetypes and usage at the position, but first, we want to highlight some of the stats that matter most for the tight end position.
Highest Correlation to Points Per Game for Tight Ends
| Category | PPR Pts | St. Pts |
|---|---|---|
| ReYds | 0.8186 | 0.7189 |
| Rec. | 0.7822 | 0.5808 |
| Targets | 0.6722 | 0.4951 |
| ReTD | 0.5242 | 0.6779 |
| Snaps | 0.3421 | 0.2555 |
Looking at every game played over the 2012-2018 seasons, these are the stats that matter the most for tight ends on the weekly level for fantasy output. You obviously can’t have anything without first playing a snap and then being targeted, but empty volume calories also depreciate the raw opportunities of snaps and targets under actual output in catches and yardage. The tradeoff from receptions and touchdowns between each scoring format is hardly a revelation but shows how much you should be prioritizing players who score more touchdowns in standard leagues while reception-based players gain more viability in PPR.
We’re going to highlight some of those specific players in a bit, but first, we also want to take a look at which yearly stats have the most carryover for tight ends.
Year-Over-Year Correlation Categories for Tight Ends
| Category | YOY |
|---|---|
| ReYd/Gm | 0.6083 |
| Tgt/Gm | 0.5936 |
| Rec/Gm | 0.5836 |
| PPR Pts/Gm | 0.5652 |
| ReYds/Season | 0.5466 |
| Targets/Season | 0.5368 |
| St Pts/Gm | 0.5305 |
| Rec/Season | 0.5266 |
| St. Pts/Season | 0.4805 |
| PPR Pts/Season | 0.4643 |
| Snaps/Season | 0.4464 |
| ReTD/Gm | 0.2915 |
| ReTD/Season | 0.2641 |
| Catch %/Season | 0.1107 |
| Yards/Rec | 0.0568 |
The largest correlations in year-over-year production are at the per-game basis, which makes sense because it is inherently accounting for missed games over the bulk production. This is where you can sometimes find value hidden under the cloak of bulk output if the most current ADP is reflecting that overall output over respectable per game totals.
The most intriguing of the per-game stats is just how highly PPR points per game holds up compared to the field. Much more so than standard points, which can be explained by the high variance in touchdown output on both the per game and yearly levels, two categories listed towards the bottom. Bringing up the very tail end of things is efficiency in rate stats, something that should hardly be weighted in your expectations for a tight end.
At the top of the pile, opportunity and production per game have the most yearly rollover, which is where your player dissection should begin.
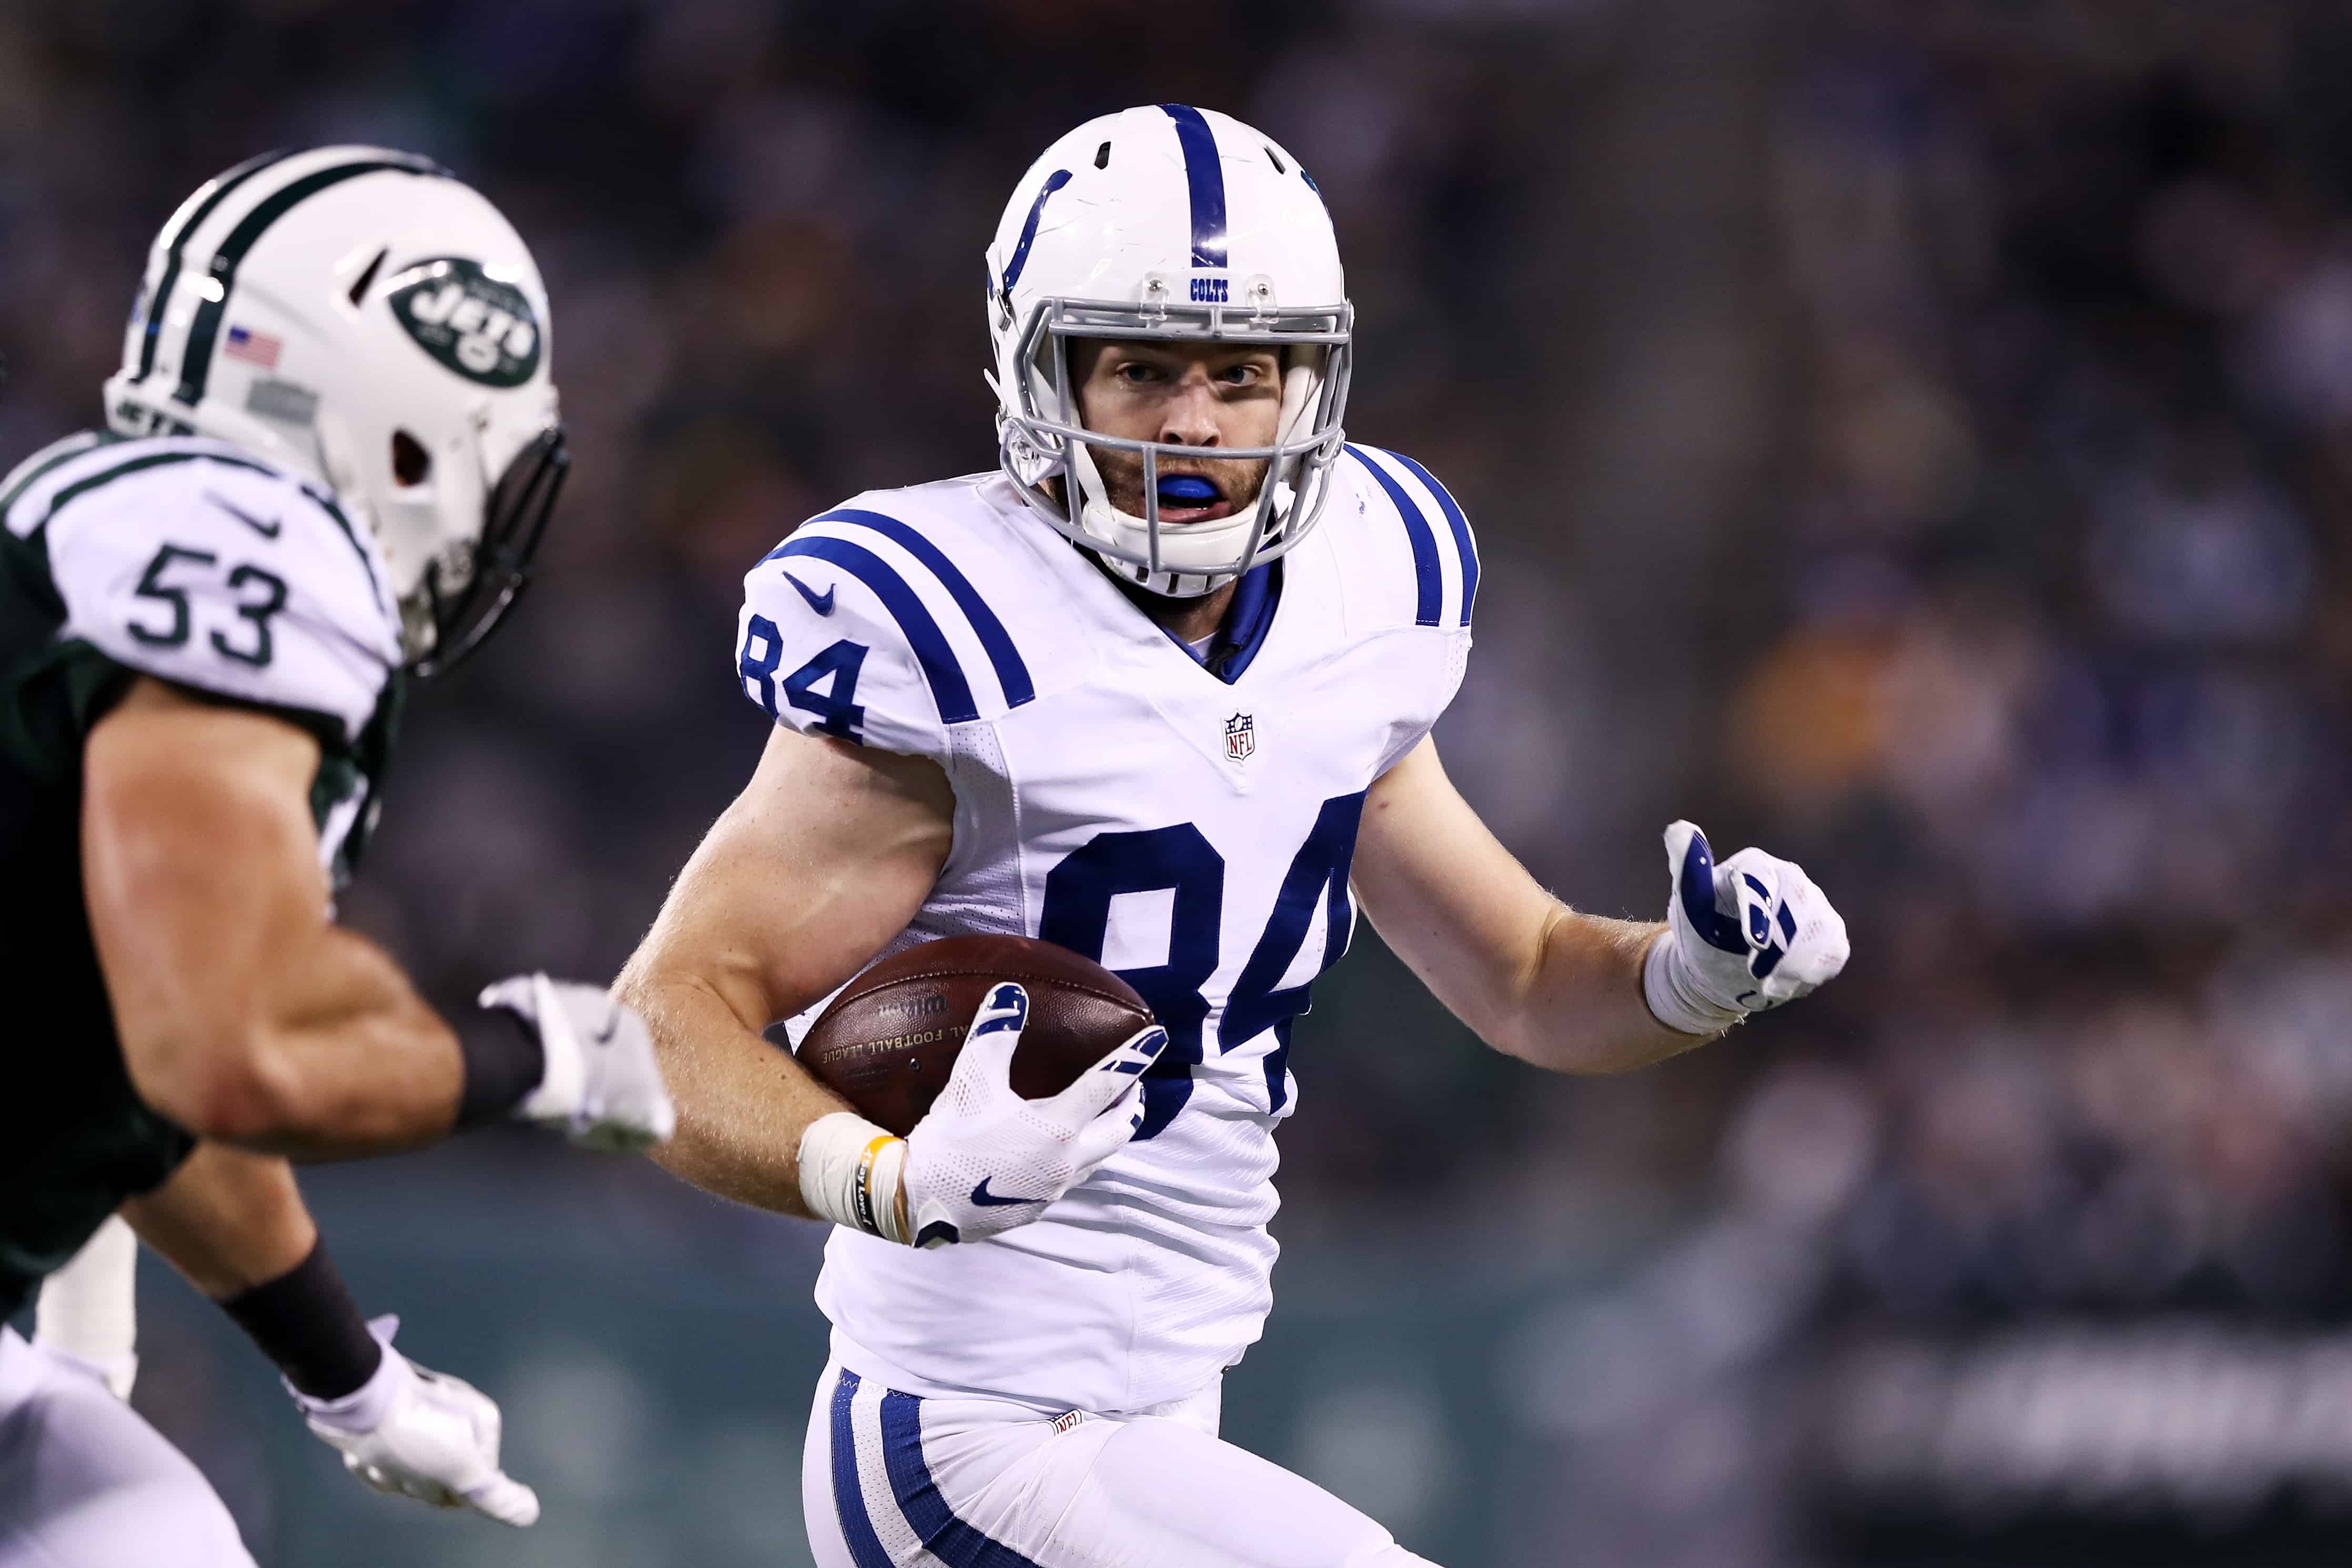
True Usage: Snaps, Routes, and Targets
One of the things that is often looked at with a bigger magnifying glass now in fantasy is player snaps. The tight end position is the most unique to discuss through that lens. Because tight end is truly a dual-role position, it’s more important to dive further under the hood of snaps played as a true opportunity for each player. We are looking for players who aren’t just playing a lot of snaps but are running passing routes over blocking because that’s where the opportunity intersects with fantasy production. Jack Doyle may be playing 81.1 percent of the team snaps per game (sixth for all tight ends), but he’s running a pass route on just 46.5 percent of those snaps played (31st) while ranking 17th in routes run per game. It’s harder to run into tangible volume that way even though Doyle was targeted on 20.8 percent of his routes run, which ranked seventh at the position. Last season, tight ends in totality ran a pass route on just 46 percent of their snaps played, but the top-12 scorers in terms of points per game ran a pass a route on 61 percent of their snaps.
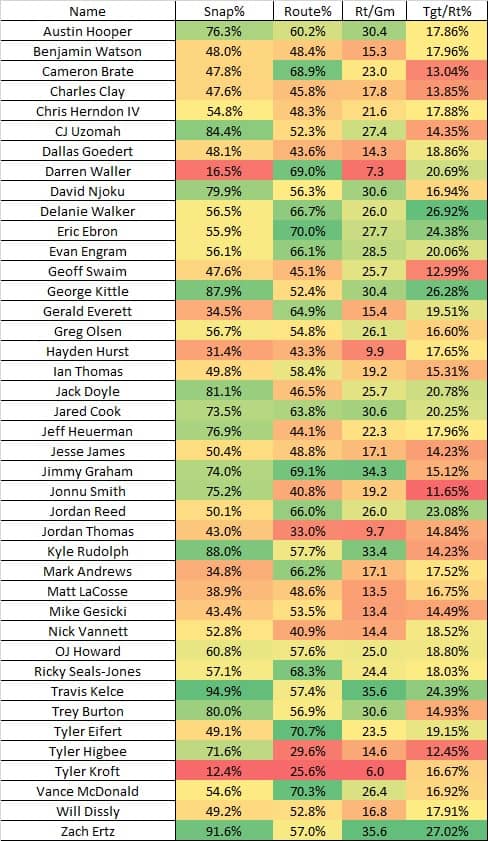
*Pass Routes via Pro Football Focus
For those curious, routes run per snap rate carries a modest .6714 R-squared for yearly rollover over the past 10 years for players with over 100 total snaps. In that context, it’s more stable than anything we discussed in the above yearly correlation for tight ends.
Over the past four seasons, no tight end has run more pass routes than Travis Kelce, who ranked seventh, fifth, first, and second in overall routes run per season over that span. In 2018, Kelce ran 60 more pass routes than he did in the 2017 season. In terms of being targeted per route while running a high amount of routes, Zach Ertz has led all tight ends in that area in each of the past two seasons. You don’t need my help in highlighting the worth of Kelce and Ertz, but there’s a reason they reside on the top of fantasy expectations at the position.
Jimmy Graham was the only tight end to rank in the top-12 in snap rate, routes run rate, and routes per game, but ranked 30th in target rate per route, which nuked his output as his production per target has dropped significantly over the past two seasons.
In the six games that both Eric Ebron and Jack Doyle played together, Doyle out-snapped Ebron 330-to-166, out-targeted him 33-to-22, out-caught him 26-to-18 and posted more yardage (245-to-228). Ebron still ran when on the field and was targeted on them at a very high rate, but inversely, the actual opportunities just weren’t there for him. We’ve already highlighted him as someone who massively outperformed near the goal line, so if his true usage reverts to an ancillary component in the offense once again with Doyle back in the lineup, then it will be hard for Ebron to live solely on touchdown production in that climate again.
Baltimore drafted a pair of rookie tight ends a year ago in Hayden Hurst and Mark Andrews. Both were near each other in terms of snap rate, but Hurst was asked to block at a much higher rate of his snaps than Andrews, which gave Andrews the clear lane to be a more productive fantasy option, which is how it played out. Hurst ran a pass route on just 43.3 percent of his snaps as a rookie while Andrews was at 66.2 percent, which ranked ninth for the players above. In the 12 games the two played together, Andrews ran more pass routes than Hurst in all 12. The downside is that Hurst still also hurts Andrews from an overall snap stance, which hurt his overall routes run. In those same 12 games, Andrews only ran 16.9 pass routes per game with a high of 17 pass routes run in a game over the seven games the two played with Lamar Jackson under center. Andrews led all rookie tight ends in receiving yardage (552 yards) on the strength of 16.2 yards per catch, but this true usage is also why he caught two or fewer passes in five of those seven regular season starts made by Jackson while he posted more than three catches just once.
This also sheds some light on just how much of an uphill battle Dallas Goedert has despite being expected to take another step forward. No team used 12 personnel more on passing downs than the Eagles did in 2018 (34 percent of pass plays) yet Goedert still checked in below Tyler Higbee in routes run per game. The only time a pair of tight end teammates both qualified as top-12 scoring tight ends in the same season as Rob Gronkowski and Aaron Hernandez. Goedert has upside and talent to be a TE1 option, but his opportunity and true path to get there are still currently roadblocked by Zach Ertz.
If looking for a deeper cut, Darren Waller hardly found the field behind Jared Cook last season, but when he did get on the field, he was running a pass route and getting targeted on those snaps. Given Cook’s high rates across the board above, Waller isn’t a poor dart throw in deep formats. He won’t command the same target share that Cook did a year ago given the situations being altered by the additions of Antonio Brown and Tyrell Williams, but Waller was a former college wide receiver that is unlikely to be blocking much on his anticipated increased snap share.
Relying on Receptions
| Player | PPR Rec% | 2018 | St Yd% | 2018 |
|---|---|---|---|---|
| Jack Doyle | 44.60% | 41.60% | 69.50% | 41.60% |
| C.J. Uzomah | 42.50% | 41.00% | 71.90% | 40.90% |
| Jason Witten | 41.10% | n/a | 75.30% | n/a |
| Jordan Reed | 41.00% | 45.10% | 71.30% | 45.10% |
| Jesse James | 40.70% | 35.60% | 68.00% | 35.60% |
| Zach Ertz | 40.20% | 41.40% | 74.20% | 41.40% |
| Austin Hooper | 40.10% | 43.60% | 70.10% | 43.60% |
| Charles Clay | 40.10% | 56.10% | 71.70% | 56.20% |
The players above are the tight ends who have relied on receptions for score fantasy points the most over their careers. The arbitrary cutoff here is having 40 percent of your PPR fantasy points generated solely off receptions, which in turn, forces you to have over two-thirds of your standard fantasy production stem from receiving yardage alone. In turn, these are the guys relying on yardage more in standard formats over actually reaching the end zone.
If you recall our post last week on which tight ends relied the most on reaching the end zone as a byproduct of short-scoring opportunities, it’s not a surprise that we see a direct overlap in that field with Doyle, Jordan Reed, and Austin Hooper. These are you low aDOT, low-scoring options.
Jason Witten falls right into this tier as someone who scored just 14 touchdowns over his four seasons prior to his one-year retirement while averaging fewer than 10 yards per catch in four of his previous six seasons played. The last time we saw Witten on the field at age -5, he posted just 3.9 receptions for 35 yards per game, the lowest marks of his career outside of his rookie season in 2003.
The one alpha tight end listed here is Zach Ertz, which is a minor red flag for if we ever see Ertz’s overall volume decline, something that isn’t out of the range of possibilities given all of the additions the Eagles made this offseason and another small step forward for second-year tight end Dallas Goedert. Ertz has scored eight times in each of the past two seasons, but his touchdown rate has only been better than the average top-12 fantasy scorers in one of his six seasons so far. He’s also averaging just 11.0 yards per reception for his career and is coming off a career-low 10.0 yards per catch in 2018. That said, even a drop from the 26 percent of the team targets he had a year ago to somewhere between the 18.2 percent and 22.9 percent he posted over the 2016-2017 seasons still firmly has him in top-5 territory as a floor outcome.
Relying on Yardage
| Player | PPR Yd% | 2018 | St Yd% | 2018 |
|---|---|---|---|---|
| George Kittle | 51.80% | 53.20% | 80.80% | 80.70% |
| Jared Cook | 49.10% | 46.30% | 79.40% | 71.30% |
| Jason Witten | 44.40% | n/a | 75.30% | n/a |
| Zach Ertz | 44.40% | 41.50% | 74.20% | 70.80% |
| Travis Kelce | 46.80% | 45.30% | 74.00% | 69.70% |
| Tyler Higbee | 44.40% | 44.80% | 73.70% | 70.90% |
| Delanie Walker | 44.80% | 56.50% | 72.50% | 100.00% |
| C.J. Uzomah | 41.40% | 41.80% | 71.90% | 70.90% |
| Charles Clay | 42.90% | 49.20% | 71.70% | 100.00% |
| Jordan Reed | 42.00% | 46.60% | 71.30% | 84.80% |
| Vance McDonald | 45.90% | 45.90% | 71.00% | 73.50% |
| Austin Hooper | 42.00% | 40.50% | 70.10% | 71.70% |
| Ed Dickson | 43.10% | 31.60% | 70.10% | 43.10% |
This bucket of tight ends is made up of the players that have had at least 40 percent of their career PPR fantasy production stem solely from yardage to go along with 70 percent of their standard fantasy production.
For the players that find themselves in both the reception and yardage buckets — Ertz, Reed, Witten, Hooper, and Charles Clay — that means these are the players who largely have had low touchdown output for their careers. Ertz has been the exception the past two years because his volume is so high he accumulates production in all three phases of scoring, but even last season, 83 percent of his fantasy output came from receptions and yardage alone.
Travis Kelce has also overcome his early career scoring bugaboos over the past two seasons, but the reason he pops up here and not in the front end is because he’s so dynamic after the catch. Kelce has ranked first or second at the position in yards generated after the catch in each of the past five seasons. Kelce’s career YAC yardage alone accounts for 24 percent of his career fantasy output in PPR formats and 38 percent of his standard scoring output.
George Kittle is nearly a Kelce clone and the one tight end that had more yards after the catch than Kelce in 2018. In fact, Kittle’s 873 yards after the catch last season was the highest recorded by a tight end in a single season as he paced his way to break the all-time overall receiving yardage mark in a single season. While repeating his lofty YAC rate (9.9 YAC per reception) from a year ago is unlikely, it also was no fluke as Kittle’s 6.2 YAC/reception ranked second for all tight ends with 40 or more catches during his rookie season. Kittle also had the early-career scoring issues that we saw from Kelce, scoring just seven times over his first two seasons. Kittle already popped up for us as a candidate to improve on his scoring output, an inline to fighting off any loss of output that stems from a reduction in team target share and loss off the top of his lofty yards generated after the catch in 2018.
A player we’ve yet to talk about a lot so far is Vance McDonald. Since entering the league in 2013, McDonald’s 13.0 yards per reception ranks eighth among all qualifying tight ends (minimum of 50 receptions) but his career-high for receptions per game in a season is just 3.3 while he’s scored just 12 career touchdowns. McDonald has the best opportunity of his career to finally take a true step forward in 2019. After posting career-highs in targets (72), receptions (50), yards (610), and catch rate (69.4 percent) to go along with four touchdowns in 2018, the Steelers lost 33.4 percent of their team targets (fifth highest) from a year ago. The Steelers also lost Jesse James, who played 562 snaps last year compared to the 563 McDonald played. The only remaining tight end on the Steelers roster with NFL experience is Xavier Grimble, who has just 22 career receptions over four seasons. Highlighting a 29-year-old tight end who has never played a full season as a breakout candidate isn’t the safest bet, but McDonald has the objective runway to have build off his career-highs set a year ago.
Relying on Touchdowns
| Player | PPR ReTD% | 2018 | St TD% | 2018 |
|---|---|---|---|---|
| O.J. Howard | 29.80% | 24.90% | 40.80% | 34.70% |
| Cameron Brate | 28.80% | 38.80% | 43.10% | 57.20% |
| Dwayne Allen | 28.70% | 0.00% | 43.00% | 0.00% |
| Tyler Eifert | 28.70% | 15.40% | 42.30% | 25.10% |
| Hunter Henry | 28.00% | n/a | 41.00% | n/a |
| Jonnu Smith | 27.40% | 28.20% | 42.00% | 41.10% |
| Kyle Rudolph | 24.30% | 15.90% | 39.30% | 27.50% |
| Jimmy Graham | 24.00% | 9.20% | 36.60% | 15.90% |
| Trey Burton | 23.10% | 24.50% | 36.90% | 38.70% |
| Vernon Davis | 22.00% | 15.90% | 33.40% | 23.70% |
| Nick Vannett | 21.70% | 24.40% | 36.10% | 40.10% |
| Gerald Everett | 21.70% | 20.80% | 33.60% | 33.60% |
| Eric Ebron | 21.00% | 35.10% | 33.20% | 49.90% |
To find the tight ends most reliant on reaching the end zone, we’re looking for the ones who had at least 20 percent of their PPR output come from touchdowns while also at least one-third of their standard scoring stem from reaching the paint.
Both Tampa Bay tight ends lead the pack here. Cameron Brate shouldn’t be a surprise since he’s averaged just 28.0 receiving yards per game for his career but has 23 touchdown receptions over the past four seasons, the ninth-most over that span. Even with O.J. Howard sidelined last season, Brate offered no weekly stability or even a high-ceiling due to his touchdown dependency.
Howard, on the other hand, has a high ceiling when he finds the end zone and has posted elite yardage per reception numbers to date. What he needs is actual volume — and to play a full season — to make everything come together. 18.3 percent of Howard’s receptions so far have gone for touchdowns, the second-highest rate for active tight ends. Showcasing his explosiveness yet again with 16.6 yards per catch in 2018, Howard ranked fourth for all tight ends in receiving yardage per game (56.5) but ranked just 14th in targets per game (4.8) and tied for 13th at the position in receptions per game (3.4).
The only tight end with a higher touchdown per reception rate than Howard for their career is Tyler Eifert. Unfortunately, the 29-year old hasn’t played more than eight games since the 2015 season and if you look at the true usage chart to open, the Bengals were limiting his opportunities by making him a role player in the passing game in all likelihood as an attempt of preservation.
All of Hunter Henry, Kyle Rudolph, and Jimmy Graham were hits for tight ends who have relied on their teams setting up their touchdown opportunities to date. In that post, Henry appeared to only be limited by his actual playing time so far throughout his career compared to the others. Graham’s recent output has just been him being defeated by Father Time compared to the player he used to be, but this is who Rudolph has been his entire run. Never much of a yardage threat — he averaged 9.8 yards per catch over his eight-year career with one season over 634 yards — Rudolph was actually fourth for all tight ends in routes run per game last season, but his team target share (13.5 percent) was his lowest over his past four full seasons while he ranked 36th in target rate per route run at 14.2 percent.