

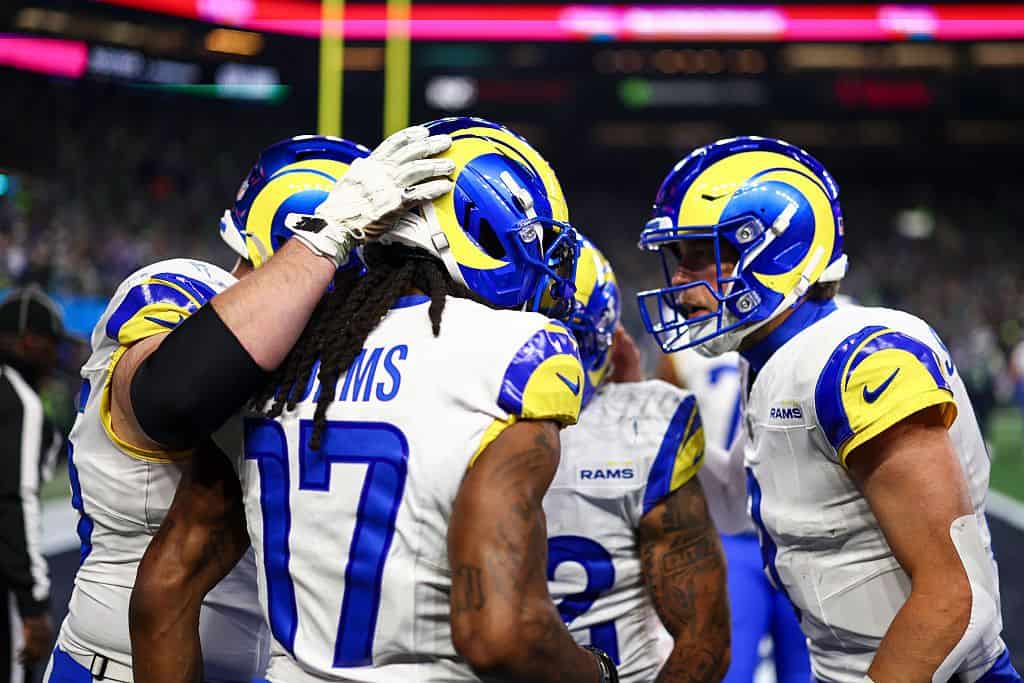
Every offseason, I break down the NFL offensive trends that will shape the upcoming season, including a deep dive into team red-zone performance.
The goal for these articles is straightforward.
We are monitoring the league's current state to identify any outliers, which we can then incorporate into the upcoming season while also gauging league trends.
While we have already examined all the positional tiers for 2026, it is always beneficial to review the league's overall landscape.
Every NFL season is unique, so this is always a great way to lay some groundwork.
| 2026 Fantasy Football Odds & Trends |
|---|
| Draft Kit Hub |
| 2026 League Trends |
| Quarterback Trends |
| Running Back Trends |
| Wide Receiver Trends |
| Tight End Trends |
| NFL Team Per Drive Trends |
| NFL Red Zone Trends |
| NFL Yardage to Touchdown Trends (Coming soon) |
| Touchdown Trends (Coming soon) |
| Red Zone Regression: Quarterbacks (Coming soon) |
| Red Zone Regression: Running Backs (Coming soon) |
| Red Zone Regression: Wide Receivers (Coming soon) |
| Red Zone Regression: Tight Ends (Coming soon) |
Don't Miss Out on The Best Fantasy Football Coverage in the Business
Like the NFL, fantasy football never sleeps.
From rankings to the best draft strategies, Sharp Football has everything you need to get ready for the fantasy season in our Fantasy Football Draft Kit, powered by premier fantasy football analyst Rich Hribar.
Save more by bundling the Draft Kit with our in-season fantasy package that features Rich's comprehensive “Worksheet” preview of every game, every week of the NFL season.
Click here for more information about our fantasy coverage!
League-Wide Red-Zone Production Since 2010
| Year | RZ/Drive | RZ TD% | NFL TD% |
|---|---|---|---|
| 2025 | 31.99% | 57.26% | 75.35% |
| 2024 | 31.91% | 57.61% | 77.24% |
| 2023 | 28.53% | 57.27% | 76.88% |
| 2022 | 29.95% | 56.81% | 75.82% |
| 2021 | 31.74% | 58.23% | 77.62% |
| 2020 | 32.92% | 62.00% | 75.87% |
| 2019 | 30.03% | 56.10% | 73.15% |
| 2018 | 29.37% | 58.82% | 74.18% |
| 2017 | 26.78% | 52.42% | 71.36% |
| 2016 | 29.57% | 55.26% | 74.86% |
| 2015 | 27.28% | 55.77% | 72.49% |
| 2014 | 27.91% | 53.28% | 71.86% |
| 2013 | 27.13% | 55.20% | 73.48% |
| 2012 | 27.05% | 53.75% | 72.97% |
| 2011 | 27.30% | 51.98% | 72.31% |
| 2010 | 26.84% | 52.16% | 71.48% |
*All Drives exclude possessions that end in kneel-downs
We opened this series last week by highlighting how NFL offenses continued to find answers and produce points last season.
Just under 32% of all drives last season reached the red zone, the highest rate since 2020.
That was the second-highest rate in the sample above, just a tick above the 2024 season.
The conversion rate of red-zone trips into touchdowns dipped slightly from 2024 but remained on track for recent output.
Over the past three years, red-zone touchdown rates have been stable.
A positive from last season is that offenses relied on the red zone less than the previous two seasons.
75.4% of the offensive touchdowns were still scored from the red zone, but there was a solid spike in the rate of touchdowns that were scored from outside of the red zone.
333 touchdowns were scored from outside of the red zone last season, the most in a season since 2020.
That stopped a recent surge in reliance on shorter touchdowns, the highest rate of touchdowns scored from outside the red zone in the 2020s.
It is no secret that the closer you get to the end zone, the easier it is to produce a touchdown.
Since 2010:
- 73.7% of all red-zone touchdowns come from inside the 10-yard line. In 2025, that rate was 73.1%.
- 47.3% of all red-zone touchdowns are scored from inside the 5-yard line. In 2025, that rate was 47.2%.
- 86.4% of all rushing touchdowns come from inside the red zone. In 2025, that rate was 84.1%.
- 67.1% of all passing touchdowns come from inside the red zone. In 2025, that rate was 69.1%.
- 73.9% of all rushing touchdowns come from inside the 10-yard line. In 2025, that rate was 73.1%.
- 43.8% of all passing touchdowns scored overall come from inside of the 10-yard line. In 2025, that rate was at 44.0%.
- 57.1% of all rushing touchdowns come from inside the 5-yard line. In 2025, that rate was 53.5%.
- 22.7% of all passing touchdowns scored overall come from inside the 5-yard line. In 2025, that rate was 23.8%.
- 32.5% of all rushing touchdowns overall come from the 1-yard line. In 2025, that rate was 28.6%.
What stands out from 2025 is something that we have highlighted throughout last week.
Offenses are throwing more out of heavy personnel, and that ties into the red zone.
The five highest rates of passing touchdowns to come from inside of the 5-yard line since 2010 have been over the past five seasons.
2025 had the lowest rate of total rushing touchdowns scored inside the 5-yard line in our sample.
2025 also had the lowest rate of total rushing touchdowns scored from the 1-yard line in our sample.
Dropback rate in the red zone has gone up in each of the past two seasons across the league.
With that set up, let’s look at the success rates that each team had reaching (or bypassing) the red zone per possession in 2025.
How Often Did NFL Teams Get Into Scoring Position in 2025?
| Team | Drives | RZ Drives | >RZ TD | RZ+TD Drive% |
|---|---|---|---|---|
| Arizona Cardinals | 169 | 61 | 5 | 39.05% |
| Atlanta Falcons | 174 | 50 | 5 | 31.61% |
| Baltimore Ravens | 168 | 59 | 18 | 45.83% |
| Buffalo Bills | 162 | 65 | 16 | 50.00% |
| Carolina Panthers | 156 | 45 | 9 | 34.62% |
| Chicago Bears | 175 | 55 | 15 | 40.00% |
| Cincinnati Bengals | 174 | 54 | 11 | 37.36% |
| Cleveland Browns | 191 | 38 | 6 | 23.04% |
| Dallas Cowboys | 171 | 65 | 12 | 45.03% |
| Denver Broncos | 177 | 57 | 10 | 37.85% |
| Detroit Lions | 180 | 64 | 16 | 44.44% |
| Green Bay Packers | 151 | 59 | 10 | 45.70% |
| Houston Texans | 182 | 54 | 9 | 34.62% |
| Indianapolis Colts | 163 | 66 | 9 | 46.01% |
| Jacksonville Jaguars | 180 | 68 | 9 | 42.78% |
| Kansas City Chiefs | 164 | 59 | 4 | 38.41% |
| Las Vegas Raiders | 176 | 36 | 7 | 24.43% |
| Los Angeles Chargers | 167 | 57 | 9 | 39.52% |
| Los Angeles Rams | 168 | 76 | 15 | 54.17% |
| Miami Dolphins | 171 | 48 | 10 | 33.92% |
| Minnesota Vikings | 172 | 51 | 4 | 31.98% |
| New England Patriots | 159 | 63 | 17 | 50.31% |
| New Orleans Saints | 171 | 45 | 8 | 30.99% |
| New York Giants | 165 | 59 | 15 | 44.85% |
| New York Jets | 176 | 38 | 9 | 26.70% |
| Philadelphia Eagles | 168 | 44 | 12 | 33.33% |
| Pittsburgh Steelers | 168 | 51 | 12 | 37.50% |
| San Francisco 49ers | 174 | 66 | 5 | 40.80% |
| Seattle Seahawks | 160 | 59 | 12 | 44.38% |
| Tampa Bay Buccaneers | 174 | 50 | 12 | 35.63% |
| Tennessee Titans | 179 | 33 | 6 | 21.79% |
| Washington Commanders | 157 | 46 | 9 | 35.03% |
Last season, three different offenses reached the red zone (or bypassed it with a long touchdown) on at least half of their possessions.
That was not only the most in a season in the 2000s, but there have only been seven other teams to have a 50% rate since 2000.
The Rams were at the front of things, reaching the red zone or scoring a touchdown before the red zone on 54.2% of their drives.
Only the 2007 Patriots (56.3%) have had a higher rate in the 2000s.
The Bills and Patriots joined them as the other teams to hit this high-end rate of efficiency.
| Team | Year | RZ+TD Drive% | N+ RZ+TD Drive% | Diff | N+TD | Diff |
|---|---|---|---|---|---|---|
| New England Patriots | 2007 | 56.33% | 42.53% | -13.80% | 42 | -25 |
| Los Angeles Rams | 2025 | 54.17% | TBD | TBD | TBD | TBD |
| New Orleans Saints | 2011 | 53.80% | 37.37% | -16.43% | 53 | -9 |
| Kansas City Chiefs | 2018 | 52.76% | 42.07% | -10.69% | 46 | -20 |
| Detroit Lions | 2024 | 52.33% | 44.44% | -7.88% | 56 | -12 |
| New England Patriots | 2010 | 51.59% | 45.56% | -6.04% | 57 | 1 |
| Indianapolis Colts | 2004 | 51.50% | 44.24% | -7.25% | 49 | -12 |
| Indianapolis Colts | 2007 | 51.27% | 38.00% | -13.27% | 41 | -10 |
| New England Patriots | 2025 | 50.31% | TBD | TBD | TBD | TBD |
| Buffalo Bills | 2025 | 50.00% | TBD | TBD | TBD | TBD |
Every other team operating at this high of a level experienced a decrease in their rate and scored fewer touchdowns the following season.
As a reminder, even with regression, all of those teams still scored 40-plus touchdowns the following season.
Last year’s Detroit offense experienced regression across the board, but they still were third in the league in touchdowns scored and ninth in rate of drives to reach the red zone or score a touchdown from outside of the red zone.
Four other teams (the Colts, Ravens, Packers, and Cowboys) also had a 45% or higher rate.
There have been 30 other teams before last season to hit that arbitrary threshold in the 2000s.
Only the 2024-2025 Bills had a higher rate of drives reaching the red zone or producing a touchdown before the red zone the following season.
Even last year’s Buffalo team lost a couple of touchdowns from 2024.
Only three of those 30 teams scored more touchdowns the following season.
Those teams lost an average of 13.6 touchdowns per team.
Last season, there were four teams in this bucket, with the Bills (-3), Eagles (-10), Lions (-12), and Commanders (-15) all losing touchdowns compared to their totals the previous season.
Another six teams (Giants, Lions, Seahawks, Jaguars, 49ers, and Bears) were at 40% or better.
Out of the 108-team sample to meet those thresholds, only 25 (23.1%) had a higher rate the following season.
74 of those teams (68.6%) scored fewer touchdowns the following season, with an average loss of 12.2 touchdowns per team.
All nine teams in this bucket from 2024 scored fewer touchdowns in 2025 than the previous season.
Flipping things around and going to the bottom of the barrel here, three teams reached or bypassed the red zone for a touchdown on less than 25% of their possessions, which were the Titans, Browns, and Raiders.
We have a 94-team sample of offenses falling in that bucket of ineptitude in the 2000s.
88 of those teams (93.6%) had a higher rate the following year, while 73 of those teams (77.7%) scored more offensive touchdowns.
Those teams averaged a 10.5-touchdown increase per team.
There was only one other team (the Jets) with a rate below 30%.
Getting to the red zone is one thing.
Converting those opportunities into touchdowns is another part of the story.
How Often Did NFL Teams Convert Red-Zone Visits Into Touchdowns in 2025?
| Team | RZ Drives | RZ TD | RZ TD% |
|---|---|---|---|
| Philadelphia Eagles | 44 | 31 | 70.45% |
| Cincinnati Bengals | 54 | 36 | 66.67% |
| Buffalo Bills | 65 | 43 | 66.15% |
| Washington Commanders | 46 | 30 | 65.22% |
| Indianapolis Colts | 66 | 43 | 65.15% |
| San Francisco 49ers | 66 | 43 | 65.15% |
| Los Angeles Rams | 76 | 48 | 63.16% |
| Detroit Lions | 64 | 40 | 62.50% |
| Atlanta Falcons | 50 | 31 | 62.00% |
| Jacksonville Jaguars | 68 | 42 | 61.76% |
| Pittsburgh Steelers | 51 | 30 | 58.82% |
| Chicago Bears | 55 | 32 | 58.18% |
| Denver Broncos | 57 | 33 | 57.89% |
| Green Bay Packers | 59 | 34 | 57.63% |
| Kansas City Chiefs | 59 | 34 | 57.63% |
| Tennessee Titans | 33 | 19 | 57.58% |
| New England Patriots | 63 | 36 | 57.14% |
| Dallas Cowboys | 65 | 37 | 56.92% |
| Minnesota Vikings | 51 | 29 | 56.86% |
| Miami Dolphins | 48 | 27 | 56.25% |
| Seattle Seahawks | 59 | 32 | 54.24% |
| Arizona Cardinals | 61 | 33 | 54.10% |
| Tampa Bay Buccaneers | 50 | 27 | 54.00% |
| Carolina Panthers | 45 | 24 | 53.33% |
| Cleveland Browns | 38 | 20 | 52.63% |
| Las Vegas Raiders | 36 | 18 | 50.00% |
| Baltimore Ravens | 59 | 28 | 47.46% |
| New York Giants | 59 | 28 | 47.46% |
| Los Angeles Chargers | 57 | 27 | 47.37% |
| Houston Texans | 54 | 25 | 46.30% |
| New York Jets | 38 | 17 | 44.74% |
| New Orleans Saints | 45 | 20 | 44.44% |
The Eagles did not get to the red zone last season at the same rate they did in 2024, but when they did, they converted those trips into touchdowns.
Philadelphia was just the 24th team in the 2000s to have a red-zone touchdown rate of 70% or higher.
Not one of the previous 23 teams had a higher conversion rate the following season.
The Eagles can reach the red zone more often to raise their touchdown totals, but that will also be bucking a trend.
Only four of those 23 teams scored more overall touchdowns the following season, while those that declined lost an average of 12.9 red zone touchdowns.
The Ravens were the poster child for this a year ago.
After converting a league-high 74.2% of the red-zone trips into touchdowns in 2024, they fell all the way to 27th last season (47.5%) while scoring 21 fewer touchdowns overall.
Last year’s Ravens got hit harder than normal, becoming only the fifth team in the 2000s to lead the league in red-zone conversion rate one season and then fall into the bottom 10 the following year.
The Bills were also in this bucket last year, and even though they did experience some decline from their 2024 rates and red-zone touchdowns, they still were among the league leaders.
Nine other teams (Bengals, Bills, Commanders, Colts, 49ers, Rams, Lions, Falcons, and Jaguars) converted over 60% of their red-zone trips into touchdowns.
77.2% of the teams to hit that rate experienced a drop-off the following season, with an average decline of 6.9 touchdowns per team.
Of the nine teams to fit this criteria in 2024, only one (the Bears) scored more touchdowns last season than they did the previous season.
A few teams were good at reaching the red zone at a high rate but struggled to cash in those attempts.
The Cowboys, Patriots, and Cardinals were all top-10 in the league in red zone opportunities but were below the league’s base rate in turning those trips into touchdowns.
At the bottom, there were six teams (Ravens, Giants, Chargers, Texans, Jets, and Saints) that converted less than 50% of their red-zone opportunities into touchdowns.
We have a gaudy 254-team sample falling below that threshold in the 2000s.
76.4% of those teams raised their touchdown rate in the red zone the following season.
Of the seven teams in this department from 2024, six improved in 2025, with the Cowboys and Patriots each scoring 14 more red-zone touchdowns than they did the year before.
The Ravens and Chargers are appealing candidates to spike in 2026, with gamers pricing in a handful of their players. But the Texans, Giants, Jets, and Saints could spike as well and not be currently priced in.
Goal-To-Go Touchdown Rate, 2025:
| Team | Drives | TD | TD% |
|---|---|---|---|
| Indianapolis Colts | 32 | 30 | 93.75% |
| Atlanta Falcons | 26 | 23 | 88.46% |
| Philadelphia Eagles | 26 | 23 | 88.46% |
| Buffalo Bills | 34 | 29 | 85.29% |
| Los Angeles Rams | 45 | 38 | 84.44% |
| Miami Dolphins | 25 | 21 | 84.00% |
| Carolina Panthers | 22 | 18 | 81.82% |
| Green Bay Packers | 26 | 21 | 80.77% |
| Washington Commanders | 26 | 21 | 80.77% |
| Jacksonville Jaguars | 35 | 28 | 80.00% |
| San Francisco 49ers | 39 | 31 | 79.49% |
| Minnesota Vikings | 24 | 18 | 75.00% |
| Baltimore Ravens | 28 | 21 | 75.00% |
| Pittsburgh Steelers | 27 | 20 | 74.07% |
| Denver Broncos | 23 | 17 | 73.91% |
| Chicago Bears | 30 | 22 | 73.33% |
| Cincinnati Bengals | 30 | 22 | 73.33% |
| Seattle Seahawks | 31 | 22 | 70.97% |
| Tampa Bay Buccaneers | 24 | 17 | 70.83% |
| Los Angeles Chargers | 24 | 17 | 70.83% |
| Las Vegas Raiders | 17 | 12 | 70.59% |
| Arizona Cardinals | 27 | 19 | 70.37% |
| New England Patriots | 40 | 28 | 70.00% |
| Dallas Cowboys | 36 | 25 | 69.44% |
| Tennessee Titans | 25 | 17 | 68.00% |
| Houston Texans | 28 | 19 | 67.86% |
| Cleveland Browns | 21 | 14 | 66.67% |
| Detroit Lions | 30 | 20 | 66.67% |
| Kansas City Chiefs | 32 | 21 | 65.63% |
| New York Jets | 18 | 11 | 61.11% |
| New York Giants | 26 | 13 | 50.00% |
| New Orleans Saints | 18 | 8 | 44.44% |
We have already established that you need to be good at reaching the red zone and getting close to the goal line to score touchdowns.
No team was better in that regard last season than the Rams.
The Rams had 45 goal-to-go opportunities on offense.
Only four teams in the 2000s have had more.
| Team | Year | G2G Opp. | TD | TD% | N+ Opp. | N+TD% | Diff | Ovr. TD Diff. |
|---|---|---|---|---|---|---|---|---|
| New England Patriots | 2012 | 49 | 39 | 79.59% | 25 | 69.44% | -10.15% | -16 |
| Denver Broncos | 2013 | 47 | 37 | 78.72% | 27 | 72.97% | -5.75% | -16 |
| Kansas City Chiefs | 2022 | 47 | 37 | 78.72% | 26 | 74.29% | -4.44% | -22 |
| Detroit Lions | 2024 | 47 | 42 | 89.36% | 20 | 66.67% | -22.70% | -12 |
| Los Angeles Rams | 2025 | 45 | 38 | 84.44% | TBD | TBD | TBD | TBD |
The previous four teams all fell below 30 goal-to-go opportunities the following season, with each team losing double-digit touchdowns overall.
No team last season was better at converting their goal-to-go opportunities than the Colts.
Offenses scored a touchdown on 74.4% of their goal-to-go possessions last year.
The Colts turned 93.8% of their goal-to-go opportunities into touchdowns.
That was third-best touchdown rate on those chances for any team in the 2000s.
Jonathan Taylor led the league with 42.7 fantasy points scored from the 1-yard line.
His previous high was 24.4 points.
In doing so, the Colts became only the seventh team to post a 90% touchdown rate or better on goal-to-go possessions.
| Team | Year | G2G Opp. | TD | TD% | N+ Opp. | N+TD% | Diff | Ovr. TD Diff. |
|---|---|---|---|---|---|---|---|---|
| Green Bay Packers | 2023 | 20 | 19 | 95.00% | 29 | 76.32% | -18.68% | 9 |
| Tennessee Titans | 2020 | 34 | 32 | 94.12% | 28 | 87.50% | -6.62% | -14 |
| Indianapolis Colts | 2025 | 32 | 30 | 93.75% | TBD | TBD | TBD | TBD |
| Tennessee Titans | 2022 | 16 | 15 | 93.75% | 14 | 63.64% | -30.11% | -3 |
| Green Bay Packers | 2020 | 42 | 38 | 90.48% | 26 | 74.29% | -16.19% | -12 |
| Kansas City Chiefs | 2003 | 31 | 28 | 90.32% | 27 | 81.82% | -8.50% | 2 |
| Dallas Cowboys | 2008 | 20 | 18 | 90.00% | 24 | 68.57% | -21.43% | -1 |
We are talking about a 32-trip sample, too.
The 2020 Packers and Titans are the only teams in this group with more opportunities than the Colts last season.
Unfortunately, none of those other teams hit 30 chances again the following season while all of them shed conversion rates.
Two of those teams did score more touchdowns overall, however.
There were nine other teams last season (Falcons, Eagles, Bills, Rams, Dolphins, Panthers, Packers, Commanders, and Jaguars) that converted 80% or more of their goal-to-go trips into touchdowns.
98 of the previous 111 teams (88.3%) to fit that criteria had a loss in conversion rate the following season.
63.9% of those previous teams scored fewer touchdowns the following season, with an average loss of 9.8 touchdowns per team.
In 2024, eight teams fit that mold.
Seven of them scored fewer touchdowns in 2025.
On the other end of things, the Saints were the only team last season to convert less than half of their goal-to-go chances into touchdowns.
They were just the 27th team in the 2000s to fail at that level.
All 26 of the previous teams converted a higher rate the following season, with an average spike of 21.6%.
23 of the 26 scored more total touchdowns the following season, with an average increase of 10.5 touchdowns per team.
The final part of this puzzle involves examining which teams had the most (and least) success at bypassing the red zone entirely.
Which NFL Teams Needed the Red Zone Most in 2025?
| Team | oTD | RZ TD | RZTD% |
|---|---|---|---|
| Los Angeles Rams | 63 | 48 | 76.19% |
| Buffalo Bills | 59 | 43 | 72.88% |
| Detroit Lions | 56 | 40 | 71.43% |
| New England Patriots | 53 | 36 | 67.92% |
| Indianapolis Colts | 52 | 43 | 82.69% |
| Jacksonville Jaguars | 51 | 42 | 82.35% |
| Dallas Cowboys | 49 | 37 | 75.51% |
| San Francisco 49ers | 48 | 43 | 89.58% |
| Chicago Bears | 47 | 32 | 68.09% |
| Cincinnati Bengals | 47 | 36 | 76.60% |
| Baltimore Ravens | 46 | 28 | 60.87% |
| Green Bay Packers | 44 | 34 | 77.27% |
| Seattle Seahawks | 44 | 32 | 72.73% |
| New York Giants | 43 | 28 | 65.12% |
| Denver Broncos | 43 | 33 | 76.74% |
| Philadelphia Eagles | 43 | 31 | 72.09% |
| Pittsburgh Steelers | 42 | 30 | 71.43% |
| Tampa Bay Buccaneers | 39 | 27 | 69.23% |
| Washington Commanders | 39 | 30 | 76.92% |
| Arizona Cardinals | 38 | 33 | 86.84% |
| Kansas City Chiefs | 38 | 34 | 89.47% |
| Miami Dolphins | 37 | 27 | 72.97% |
| Los Angeles Chargers | 36 | 27 | 75.00% |
| Atlanta Falcons | 36 | 31 | 86.11% |
| Houston Texans | 34 | 25 | 73.53% |
| Carolina Panthers | 33 | 24 | 72.73% |
| Minnesota Vikings | 33 | 29 | 87.88% |
| New Orleans Saints | 28 | 20 | 71.43% |
| New York Jets | 26 | 17 | 65.38% |
| Cleveland Browns | 26 | 20 | 76.92% |
| Las Vegas Raiders | 25 | 18 | 72.00% |
| Tennessee Titans | 25 | 19 | 76.00% |
No team relied on the red zone to produce touchdowns last season more than the 49ers.
89.6% of their touchdowns were scored from the red zone, averaging a league-low 8.5 yards per touchdown play.
They were 30th in that department in 2024 (10.4 yards per touchdown play).
Before 2024, Kyle Shanahan’s offenses in San Francisco were 11th or better in touchdowns scored outside of the red zone in five of the previous seven years.
The 49ers are still producing splash plays, too, especially in the passing game.
The 49ers were third in the NFL in passing plays of 20 or more yards the past two seasons (117) but only had 9 passing touchdowns on those plays (tied for 31st).
The Chiefs and Vikings had the fewest touchdowns scored from outside of the red zone last season (4 each).
This continues a dry spell for the Chiefs in producing big-play touchdowns.
Offensive touchdowns scored by Kansas City outside of the red zone:
- 2017: 17 (1st)
- 2018: 15 (2nd)
- 2019: 19 (1st)
- 2020: 17 (1st)
- 2021: 12 (t-7th)
- 2022: 9 (t-13th)
- 2023: 4 (t-30th)
- 2024: 6 (t-27th)
- 2025: 4 (t-31st)
The drop-off for the Chiefs coincides with Eric Bieniemy leaving as offensive coordinator.
And while he is back this season in that role, the real story coincides with Tyreek Hill leaving the offense, whose big-play upside the Chiefs have never been able to replace.
Kenneth Walker at least provides a spark for long-range touchdown upside in the run game.
The Chiefs have one touchdown run by a running back from outside of the red zone the past three seasons, tied for the fewest in the NFL.
Walker has 5 himself over that span.
Both the Ravens and Patriots were below league rate in red-zone conversions, but at least they made up some ground by ranking first and second in touchdowns scored from outside the red zone.
39.1% of Baltimore's touchdowns were scored from outside of the red zone, their highest rate in a season since 2003.
The Patriots scored 17 touchdowns from outside of the red zone, matching 2007 as their most in a season in the 2000s.
The Lions were tied for second in the NFL with New England in longer-range touchdowns.
Detroit has made a calling card here, ranking tied for second (17), first (18), and second (16) in touchdowns from outside the red zone the past three seasons.
The Bills have been top-10 in that department in each of the past four seasons.
The Bills and Eagles are the only offenses with double-digit touchdowns from outside of the red zone in each of the past four seasons.
Which teams are likely to reach the red zone at a higher rate in 2026?
- Titans
- Browns
- Raiders
- Jets
Teams likely to reach the red zone (or bypass it with long touchdowns) at a lower rate in 2026:
- Rams
- Patriots
- Bills
- Colts
- Ravens
- Packers
- Cowboys
Teams likely to have a lower success rate converting red-zone trips into touchdowns in 2026:
- Eagles
- Bengals
- Bills
- Commanders
- Colts
- 49ers
- Rams
- Lions
- Falcons
- Jaguars
Teams likely to have more success in the red zone in 2026:
- Ravens
- Giants
- Chargers
- Texans
- Jets
- Saints
Combining everything, the teams to bet on reaching the red zone more and having better success in that area are the Saints and Jets.
Overlap in teams expected to get to that area less and have a lower success rate are the Rams and Colts.