- 2024 quarterbacks carried their lowest correlation between draft position and per game scoring for top 24 picks over the entire sample, while top 12 picks had their lowest correlation since 2019.
- Players selected as QB1 options in ADP accounted for 43.1% of the QB1 scoring weeks in the 2024 season.
- 88.8% of all quarterbacks selected in the top three of their position have delivered a QB1 campaign, while nearly two-thirds of that group have produced a top six scoring season.
As we prepare for our 2025 fantasy drafts, let's examine the recent history of average draft positions to find any ongoing trends or pitfalls.
Every year, we have nearly eight full months to prepare for the draft, but just how good are we at setting the market for the season?
That's the goal for this series, along with carving out some actionable takeaways for 2025 fantasy football drafts.
Let's get started with the quarterbacks.
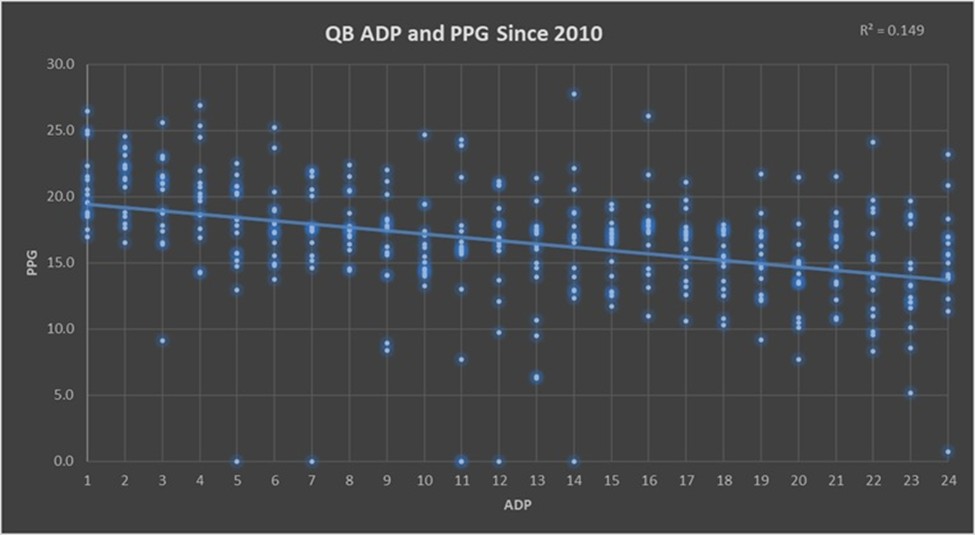
Pulling up average draft position since 2010, the relationship between the cost of quarterbacks and their points scored per game has a soft correlation on the surface.
Top 24 QB ADP & Correlation to PPR Points Per Game Since 2010
| Year | Top 24 | Top 12 |
|---|---|---|
| 2024 | 0.1741 | 0.2865 |
| 2023 | 0.1965 | 0.3021 |
| 2022 | 0.3863 | 0.5055 |
| 2021 | 0.5826 | 0.5616 |
| 2020 | 0.4995 | 0.5221 |
| 2019 | 0.3002 | 0.2538 |
| 2018 | 0.2279 | 0.3063 |
| 2017 | 0.3001 | 0.2641 |
| 2016 | 0.3591 | 0.2011 |
| 2015 | 0.3007 | 0.2671 |
| 2014 | 0.2381 | 0.3681 |
| 2013 | 0.3381 | 0.2622 |
| 2012 | 0.4958 | 0.4212 |
| 2011 | 0.2005 | 0.1679 |
| 2010 | 0.1914 | 0.2806 |
After a scorching run of drafting quarterbacks successfully from 2020 to 2022, things have quickly cooled down over the past two seasons.
2024 quarterbacks carried their lowest correlation between draft position and per game scoring for top 24 picks over the entire sample, while top 12 picks had their lowest correlation since 2019.
Lamar Jackson, Joe Burrow, and Jayden Daniels were the only quarterbacks selected in the top 12 in drafts last season who beat their ADP in terms of positional ranking and points scored.
Patrick Mahomes, C.J. Stroud, Anthony Richardson, and Dak Prescott were QB1 selections who finished double-digit spots lower in points scored than their ADP rank.
In terms of points scored per game, Mahomes, Stroud, Richardson, Prescott, and Jordan Love cost QB1 pricing and did not finish as QB1 scorers.
The QB1 draft picks who finished as QB1 scorers per game were Jackson, Burrow, Daniels, Josh Allen, Jalen Hurts, and Brock Purdy.
The options right after the QB1 border also had a nightmare run out.
Caleb Williams, Tua Tagovailoa, Trevor Lawrence, Kirk Cousins, Aaron Rodgers, and Matthew Stafford were all selected in the QB13 to QB20 range, and they all finished below their price points in overall points scored and points per game.
Daniels and Burrow were the best QB1 scorers to beat their ADP, while the best hits that did not come attached to QB1 pricing were Jared Goff (QB15 in ADP), Baker Mayfield (QB21), and Bo Nix (QB23).
All of those quarterbacks closed the season as QB1 scorers.
We also had a big-time hit in Sam Darnold, who was QB31 in ADP and ended the season QB9 in overall points and QB11 in points per game.
Don't Miss Out on The Best Fantasy Football Coverage in the Business
Like the NFL, fantasy football never sleeps.
From rankings to the best draft strategies, Sharp Football has everything you need to get ready for the fantasy season in our Fantasy Football Draft Kit, powered by premier fantasy football analyst Rich Hribar.
Save more by bundling the Draft Kit with our in-season fantasy package that features Rich's comprehensive “Worksheet” preview of every game, every week of the NFL season.
Click here for more information about our fantasy coverage!
Percentage of High Scoring Weekly Games by Top 12 QBs in ADP
| Year | Top 12 | Top 6 | Top 3 | QB1 |
|---|---|---|---|---|
| 2024 | 43.1% | 52.8% | 55.6% | 66.7% |
| 2023 | 39.4% | 51.9% | 55.6% | 66.7% |
| 2022 | 44.4% | 53.7% | 64.8% | 72.2% |
| 2021 | 52.1% | 64.8% | 79.6% | 88.9% |
| 2020 | 50.5% | 58.8% | 70.6% | 75.0% |
| 2019 | 37.3% | 39.2% | 45.1% | 52.9% |
| 2018 | 41.2% | 40.2% | 47.1% | 41.2% |
| 2017 | 34.3% | 36.3% | 35.3% | 41.2% |
| 2016 | 43.1% | 51.0% | 62.7% | 64.7% |
| 2015 | 39.2% | 45.1% | 60.8% | 70.6% |
| 2014 | 43.6% | 51.0% | 60.8% | 52.9% |
Players selected as QB1 options in ADP accounted for 43.1% of the QB1 scoring weeks on the season.
That rate was higher than in 2023, and four of the best five seasons over the sample have come since 2020.
QB1 picks posted 52.8% of the top six scoring weeks and 55.6% of the top three scoring weeks at the position.
While that is still accounting for over half of those weeks, those rates are below the group's average over the entire sample.
QB1 picks did still deliver on the higher end, accounting for 12 of the 18 weeks as the best scorer at the position.
The only quarterbacks with multiple weeks as the QB1 scorer overall were Josh Allen (4), Jayden Daniels (2), Jalen Hurts (2), and Joe Burrow (2).
Lamar Jackson only had one game as the top QB1 scorer all season, but had an immaculate floor, finishing lower than QB13 in weekly scoring just once.
The last time the QB1 in ADP also closed the season as the QB1 in overall scoring was Aaron Rodgers in 2011.
While that seems disparaging on the surface, remember the context and expectations that come with that draft selection.
These players have not completely matched and shattered those expectations, but they also have rarely bricked.
Allen was the QB1 in ADP last season, and although he was not the best overall scorer, he was still an excellent player, finishing as QB2 in overall points per game.
Unlike at the other fantasy positions, the floor here remains high even if you fall short of expectations by swinging big at quarterback.
Outside of 2QB/Superflex formats, QB1 overall and even the top options have rarely set you back in the context of the position.
QB Tiers, Rate of Players Matching or Exceeding Draft Position & High-Scoring Rates
| QB ADP | Match+ | QB1% | Top 6% | Top 3% | PPG |
|---|---|---|---|---|---|
| Top 3 | 35.7% | 88.8% | 62.3% | 35.7% | 20.4 |
| QBs 4-6 | 33.3% | 53.3% | 33.3% | 22.2% | 18.3 |
| QBs 7-9 | 46.7% | 60.0% | 24.4% | 15.6% | 17.1 |
| QBs 10-12 | 44.4% | 44.4% | 22.2% | 6.7% | 15.6 |
| QBs 13-18 | 63.3% | 40.0% | 15.6% | 6.7% | 15.5 |
| QBs 19-24 | 60.0% | 22.2% | 10.0% | 2.2% | 14.6 |
There are arbitrary cutoffs here, but by splitting up our ADP pie into front-end quarterbacks (top three in ADP), the secondary tier (QBs 4-6 in ADP), back-half QB1 options (QBs 7-9 and QBs 9-12), front-half QB2 (QBs 13-1,8), and back-half QB2 (QBs 19-24), we can further dissect the hit rates at the position and illuminate how the front of the position has carried more weight.
This also highlights the concept of “area drafting,” which can present the right pocket of the position to be in on or prevent you from unnecessarily forcing a position because you deem it a need in drafts.
The top six quarterbacks have a lower rate of matching their draft cost due to a tighter margin of error, but you can also see the rate at which players from those tiers deliver high-floor paired with high-ceiling seasons.
88.8% of all quarterbacks selected in the top three of their position have delivered a QB1 campaign, while nearly two-thirds of that group have produced a top six scoring season.
That is why if you are in a league that requires you to start multiple quarterbacks, you should be aggressive in pursuing the position.
You can run into values when waiting at the position in those formats, but it is much harder to land a front-end scoring season the further you move on.
You can see above that there is a bit of a firewall at the position once you clear the top half of the QB1 group, and diminishing returns as you move down the line.
The largest trap area has been the bucket right after the front-end options, but there is a consistent decline in the hit rate of elite seasons based on draft capital.
While the QBs 4-6 group has had higher bust rates, that group still has provided a high rate of top six and top three scoring seasons.
What is intriguing here is how the lower-end QB1 and front-half of the QB2 options blend from a points-per-game stance paired with a tighter rate of top 12, top six, and top three seasons.
Once the elite options are gone from the player pool, this is where you see gamers often start to roster fill.
They force the position, even though the rates at which that subset of options can produce truly difference-making seasons plummets, and points per game tighten up.
Back-end QB1 options still have a historical edge in success over the front half of QB2 plays, but you will have to question the squeeze versus continuing to wait.
Especially if that option does not come along with mobility, it is best to sit tight and go in another direction.
When in doubt when selecting a QB1, make sure he comes with rushing ability.

Rate of QB1 Matching or Exceeding Draft Position Based on Rushing
| RuAtt/Gm | Count | Match+ | QB1% | Top 6% | Top 3% | RuPPG |
|---|---|---|---|---|---|---|
| 8.0+ | 15 | 73.3% | 80.0% | 60.0% | 40.0% | 8.2 |
| 6.0+ | 34 | 52.9% | 76.5% | 52.9% | 38.2% | 6.8 |
| 4.0+ | 58 | 44.8% | 70.7% | 50.0% | 32.8% | 5.5 |
| 3.0+ | 86 | 41.9% | 67.4% | 43.0% | 26.7% | 4.5 |
| 2.0+ | 126 | 38.9% | 65.9% | 37.3% | 23.0% | 3.4 |
| Under 2.0 | 50 | 34.0% | 54.0% | 32.0% | 12.0% | 0.6 |
Looking at only quarterbacks who were selected as QB1 players (top 12) since 2010 and factoring in rushing attempts per game for those players, you can see how the success rate of the position is impacted by the ability to run.
I wrote the original #KonamiCode article all the way back in 2013, but it is still prevalent today in finding not only an edge in terms of ceiling but also diagnosing fragility that comes from paying a premium at the position when you are not selecting a quarterback who can also move.
Hit rates for matching ADP, turning in top 12 seasons, and providing front-end caliber seasons all rise as rushing volume does at the position.
While the 2024 season had lower top down correlations to scoring, the front-end runners were still largely successful.
Anthony Richardson was a brick, but Josh Allen, Lamar Jackson, Jalen Hurts, and Jayden Daniels were strong hits.
Kyler Murray was more meandering.
He did not outright flop, but I would label him a disappointment, finishing as QB10 in overall scoring and QB14 in points per game.
Just 15 of the 50 quarterbacks in our sample who averaged fewer than 2.0 rushing attempts per game have matched their positional ADP.
Those players have produced just seven top three scoring seasons at the position.
The last QB1 overall to average fewer than 2.0 rushes per game was Drew Brees back in 2012.
The past 10 QB1 overall scorers have all scored 3.6 or more rushing points per game.
Eight of those 10 players have averaged over 4.0 (the equivalent of a passing touchdown in standard formats).
The past six QB1 scorers overall have posted 11.7, 6.4, 7.2, 3.6, 6.5, and 8.2 rushing points per game.
Last year, Joe Burrow (2.5) and Jared Goff (2.1) were the only quarterbacks who were top 12 in points per game who averaged fewer than 3.0 rushing attempts per game.
We talked about this within the quarterback tiers, but quarterbacks who have to rely on elite passing production to anchor their fantasy lines are more fragile as you invest top dollar into them.
This group does not offer many outs through their legs when those front-end passing numbers do not show up, which opens the door for an arbitrage angle when a lower-tiered quarterback of the same archetype runs hot.
Going back to that opening section of this article and talking about the quarterbacks who were selected as QB1 options and busted, that group was littered with limited runners.
Patrick Mahomes (3.6 attempts per game), C.J. Stroud (3.1), Jordan Love (1.7), and Dak Prescott (1.6) were at the lower end of rushing opportunities.
Tua Tagovailoa (1.5 attempts per game), Aaron Rodgers (1.3), Kirk Cousins (1.6), and Matthew Stafford (1.9) were all below the 2.0 rushes per game threshold.
All of them finished below their ADP cost last year.
If you are selecting pocket passers, wait at the position and take multiple picks.
Draft Young Players
When extending things out to quarterbacks who hit outside of QB1 ADP, targeting a young quarterback who can run has been advantageous.
Fantasy gamers are notorious for needing to see something first before paying a premium sticker price, but if you want to hunt for values, a tried and true way to find players to crush ADP is drafting young players.
Since 2010, we have had 67 different QB1 scoring seasons from quarterbacks who did not have an ADP as a QB1.
38.8% of those came from players in their first three seasons in the league.
20 of those (29.9%) have come from year one or two players.
You have to go back to 2014 to find a season that did not have a year one or two player who was a QB1 scorer selected outside the top 12 in ADP.
Last year, we had Bo Nix.
This year, Caleb Williams, Drake Maye, J.J. McCarthy, Michael Penix, and Cam Ward are passers we are expecting to be full-season starters in year one or two and are being selected as QB2 options.
Maye is the premier standout from that group who comes attached to the rushing opportunities we are looking for, but you can make a case that all of the others also have rushing outcomes that come with upside.
Key Takeaways
- 2024 was another down year for setting the market at the quarterback position overall.
- Despite that, front-end options remained solid picks due to their overlap with rushing output.
- You do not have to be the first gamer to pick a quarterback in your league, but be aggressive with the front tier at the position, especially in 2QB/Superflex formats.
- If you do miss out on the front end of the position, sit on your hands. Do not force the issue on a player who does not offer mobility.
- When in doubt, break ties in favor of the QB who will run more.
- Be wary of paying a QB1 premium for pocket passers.
- Draft young players (years one or two) when value-hunting QB2 options.