With the 2020 NFL schedule release scheduled for Thursday night, we are continuing to look back at how the schedules played out and impacted the fantasy landscape a year ago.
So far, we have already run through the quarterback, running back, and wide receiver positions in terms of strength of schedules and performances based on their respective slate of opponents. As a byproduct, we also covered how each team defense made out under the same lens versus those positions. With the methodology used in those opening two posts, we are moving on to the tight end position and team defenses versus opposing tight end groups.
Without a baseline for points scored in Week 1 outside of the prior season statistics, those games both went into the player and team points averages allowed, but we are focusing on the subsequent games played Weeks 2-17 once we started applying 2019 output to the sample.
2019 Fantasy Strength of Schedule and TE Performance
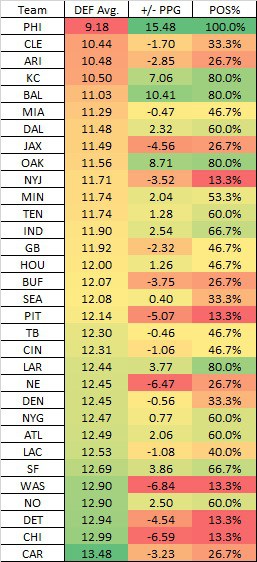
*DEF Avg. = Average PPR Fantasy Points allowed per game prior entering that matchup
*+/- PPG = On average how the Team TEs scored per week vs. that prior DEF Avg.
*Positive % = Percentage of games in which the TEs outscored the prior DEF Avg
Immediately what jumps out here is the have and have nots. Teams at the top of the league in positive point differential for tight ends versus what their opponent had previously allowed to the position prior to that matchup are all teams that 1) use their tight ends in the passing game and 2) because they have functional players at that position. The top-five teams in point differential versus matchup were the Eagles, Ravens, Raiders, Chiefs, and 49ers despite all of those teams outside of the 49ers facing schedules among the top-10 in hardest difficulty based on opponent entering the matchup.
Regardless of schedule difficulty, the teams in the former bucket regularly outscored their opponent average. The only two of the 15 teams with a positive point differential over their opponent’s prior average for the season that also failed to beat that opponent average in over half of their games played were the Seahawks and Texans.
A couple of notes from two of the top teams…
The Eagles already use multiple tight ends among the league’s highest rates as a part of their scheme, but last season they were forced to enhance their reliance on Zach Ertz and Dallas Goedert to carry the passing game. Alshon Jeffery (10 games played), Nelson Agholor (11), and DeSean Jackson (three) all missed large chunks of the season while none of their depth panned out. Ertz (135) and Goedert (87) were the top two target leaders on the team for the season. As a byproduct, the Eagles outscored their opponent’s previous points allowed mark going into the matchup in every single game last season. Only the Ravens targeted their tight ends (41%) more than the Eagles (39%).
Tied for second in the league in rate of games with more points scored than their opponent’s prior average was the Rams. Their use of the tight end position was a new development this season. After only targeting the position 17% of the time in 2017 and 16% in 2018 under Sean McVay, Rams’ tight ends received 26% of the team targets a year ago.
Last season, the Rams used 11 personnel (3 WRs) on 76% of their plays Weeks 1-12 and 12 personnel (2 TEs) just 17% of the time during those weeks. Over the final five weeks of the season, the Rams then used 12 personnel on 40% of their offensive snaps and 11 personnel on just 59% of plays. It was a small sample and the Rams did face the 10th-easiest passing efficiency over that span, but the team averaged 29.0 points per game and scoring a touchdown on 31.5% of their possessions after averaging 22.6 points per game and scoring a touchdown on 19.7% of their possessions prior.
Tyler Higbee himself accounted for 43 receptions for 522 yards and two touchdowns over that span, including a four-game stretch in which he became the first tight end in league history to have at least seven receptions and 100 receiving yards in four consecutive games played.
Since a lot of defensive metrics are offensively influenced, we can turn the tide and look at which teams had a soft road or were elevated by their slate of opponents and which teams were strong at limiting the scoring output that their opponents had previously been posting.
2019 Defensive Fantasy Strength of Schedule and TE Performance
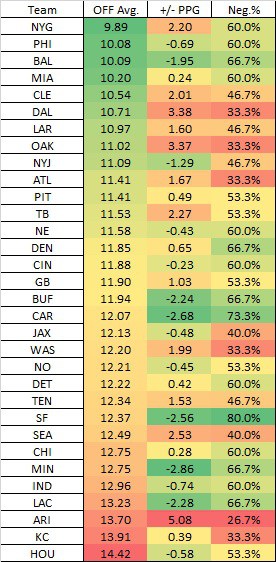
*OFF Avg. = Average team TE PPR Fantasy Points scored per game prior to facing the DEF
*+/- PPG = On average how the TEs scored per week vs. that prior OFF Avg.
*Negative % = Percentage of games in which the TEs failed to reach their season average prior to that point
- Whether in a seasonal league or in DFS, if you played fantasy football last season, you likely started a tight end at some point versus the Cardinals. Arizona did face the third-highest slate of tight end production entering their matchup and they accelerated that production by allowing a league-high 5.1 more points per game than their opponents averaged coming in. The addition of Isaiah Simmons and his versatility could be a thorn in that production spilling into 2020.
- A few other teams that were positive targets regularly were the Cowboys, Raiders, Falcons, Chiefs, and Washington, who all were in negative point differential versus their opponent output entering the matchup and all of those teams allowed at least two-thirds of their opponents to outscore their previous average.
- On the other end, looking at a few teams that were strong against the position, the Vikings, 49ers, Panthers, Chargers, and Bills all allowed at least two or fewer points per game than their opponent average coming in while all of those teams were 16th or lower in ease of schedule difficulty. All of those teams held at least two-thirds of their opponents below their season average coming into the matchup.