- NFL Wide Receiver use
- Wide Receivers are the highest fantasy scorers
- Wide Receivers are the safest position to draft
Make sure you don’t miss any part of our fantasy football draft prep by checking out our fantasy football draft kit, which will feature all of Rich Hribar’s articles, rankings, and a printable cheat sheet.
![]()
After taking a top-down fantasy look at the tight end and running back positions, we’re moving right along on the same track by focusing our fantasy lens on the wide receivers. From our typical starting block, we’re going to look at leaguewide usage of the position over the past decade and see how the 2018 season measured up.
League Wide Receiver Usage Over the Past 10 Seasons
| Year | Tgt | Tgt% | Rec | Rec% | ReYd | ReYd% | ReTD | ReTD% |
|---|---|---|---|---|---|---|---|---|
| 2009 | 9798 | 57.52% | 5622 | 54.20% | 74292 | 62.47% | 431 | 60.70% |
| 2010 | 9983 | 57.81% | 5701 | 54.34% | 75728 | 62.61% | 480 | 63.91% |
| 2011 | 10070 | 57.84% | 5691 | 54.39% | 78618 | 62.73% | 473 | 63.49% |
| 2012 | 10502 | 59.04% | 6046 | 55.81% | 80823 | 64.17% | 491 | 64.86% |
| 2013 | 10586 | 58.37% | 6114 | 55.07% | 81603 | 63.17% | 483 | 60.07% |
| 2014 | 10585 | 59.20% | 6342 | 56.63% | 82829 | 64.26% | 485 | 60.10% |
| 2015 | 10568 | 57.75% | 6299 | 54.65% | 82560 | 62.22% | 519 | 61.64% |
| 2016 | 10906 | 59.61% | 6537 | 56.72% | 83522 | 63.82% | 501 | 63.74% |
| 2017 | 9914 | 56.69% | 5817 | 53.58% | 75070 | 61.19% | 435 | 58.70% |
| 2018 | 10102 | 57.17% | 6363 | 55.51% | 81635 | 62.67% | 532 | 62.81% |
As was the case with the running back position just flatlining in the 2015 season, wide receivers hit more than a speed bump in 2017 output and were able to rebound in a big way last season after that 2017 leaguewide passing collapse sunk their production. With 2018 scoring offenses and passing games rebounding to historic levels, wideouts combined for the most receiving touchdowns over the past decade and in turn combined to score their most collective standard league fantasy points (11,681.2 points) ever while posting their second-highest mark in PPR output (18,044.2 points), trailing only the 2016 season. From a leaguewide target, reception, and yardage share, the position has maintained steady rates in usage. With the position occupying more real life rosters than the other fantasy skill positions, their collective usage and production inherently makes up the crux of all receiving production.
With the position as a whole rising back from the ashes, let’s go a step further under the hood of that scoring and see how each level of fantasy wideout was impacted.
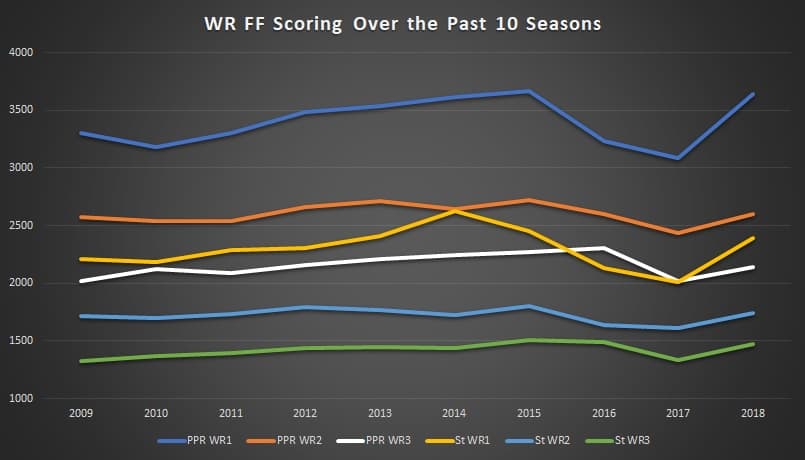
The top of the receiver position for overall fantasy output (WR1-12) were the biggest benefactors of the offensive explosion, collectively posting their highest-scoring season since 2015 in either scoring formats. After a two-year decline in PPR formats overall, while failing to account for at least 20 percent of positional output altogether, these top-scorers accounted for 20.2 percent of the fantasy production generated by receivers. For some context, there were 219 wide receivers who registered a target or rushing attempt in 2018.
There was some concern with the league shifting to more passing sets and using their third and fourth receiver on the field more than ever that the top of the position was in some jeopardy in holding its fantasy edge over their peers. But after a steady drumbeat of increased WR3 production in PPR formats over the 2011-2016 seasons, that third tier of fantasy wideouts has slowed down. Fantasy WR3s accounted for just 11.9 percent of the fantasy output for the position last season, their lowest rate of the past decade. Not pictured here, but the WR4 tier (WR37-48) also matched that same low-mark of the past decade, accounting for just 9.9 percent of the fantasy production after averaging 11.0 percent over the 2009-2017 seasons.
Going further into the arbitrary buckets of scoring, here is what has made up each scoring tier and what a wide receiver looks like from those groupings over that time span.
| Tier | Tgt | Rec | ReYd | ReTD | PPR Pts | St Pts |
|---|---|---|---|---|---|---|
| WR1 | 149.3 | 94.7 | 1323.3 | 9.2 | 283.9 | 189.2 |
| WR2 | 122.1 | 73.4 | 1007.6 | 6.9 | 216.8 | 143.4 |
| WR3 | 102.5 | 61.7 | 829.1 | 5.4 | 178.8 | 117.1 |
| WR4 | 91.7 | 54.2 | 725.3 | 4.5 | 154.5 | 110.9 |
Without getting too far ahead of ourselves and the correlations post that is coming up on Wednesday, the name of the game for wideouts is similar to that of running backs. You want to chase opportunities per game. This is how you can realistically develop a ceiling stance for a wide receiver for fantasy based on target opportunities you are projecting. Last season, Robert Woods had the fewest amount of targets for a WR1 with 130. If you’re not projecting that level of target volume for a player, you can’t hold him in that regard. This is what has always kept someone like Brandin Cooks – who has 117, 114 and 117 targets over the past three seasons- from making that full step forward to the top of the position.
This is also often how you can spot some of your biggest top-scoring outliers to proceed with caution on entering a new season or those who to prop up who disappointed relative to their opportunity. Last season, Tyler Lockett was the WR16 in overall scoring on just 71 total targets. That’s a far cry from historical norms that matched that type of limited opportunity. He has more targets incoming this season, but his 2018 season was a historical outlier.
For players with a limited sample who are due for a significant opportunity spike, finding the number of potential targets that player can reach is a good proxy for hashing out ceiling and floor outcomes. If you have someone like Lockett or Chris Godwin — who had 95 targets in 2018 and was the WR27 — making a jump up to having a 100-target floor with 125-plus target upside, you can get a much better gauge of when and where is the right time to select players in drafts based on those ranges of outcomes.
On the other end of the spectrum, if you have players such as Alshon Jeffery or Allen Robinson projected in that 120-plus target range, then their current price points of being consistently drafted as WR3s in fantasy can create some value on that cost. Of course, nothing is 100 percent in our field and you can still run into 2018 Jarvis Landry or Corey Davis, but the pursuit of opportunity on a per-game level is where you want to start at the position.
Scoring and Opportunity Cost
When covering running backs a week ago, we discussed how having a high-scoring running back was the biggest positional edge you can have over the field since the average fantasy scoring gap over each subsequent player at the position is broader than the wide receiver one on a seasonal and weekly level. But like the tight end position, not everyone is going to have a top running back and the opportunities to land one are limited. While it’s true that baseline scoring output for the wide receiver position is much more usable than that for running backs — which gives worse fantasy options more elevation due to supply and demand — the overall scoring of the wide receiver position itself has been higher per player on a weekly level.
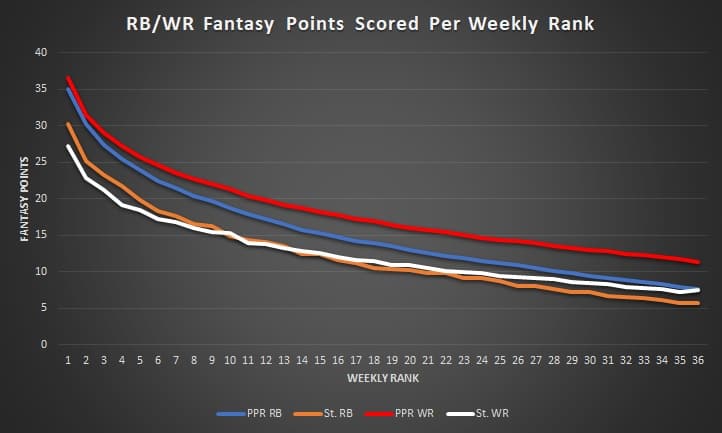
Over the past five seasons, wide receivers have just flat-out outscored running backs in PPR formats. If you circle all the way back to our opening post on tight ends, wideouts also hold their own compared to the running back position in terms of repeated weekly success by the same players, so we’re not just talking about the random one-week spike scorers elevated by the overall girth of the position.
Moving down the line in standard-scoring formats, wideouts finally match and bypass the running back position in the mid-RB2 range. That RB2 drop-off lines right up along with that area of the draft where we highlighted the highest bust rates and one to proceed with caution with when drafting. This is why drafting WR-heavy has increased in popularity and why going after an RB bell cow very early and then drafting pass catchers for several rounds — bypassing that initial minefield of RB2 that evens out in terms of bust rates down the line — before circling back to the running back position can be successful. If you’re in a league that forces you to start three wide receivers; you already need more receivers on your roster than running backs and if your league has additional FLEX positions on top of three wideouts, the necessity for roster allocation to the position is enhanced.
Where most people mistake “Zero-RB” or WR-heavy drafting is in the allocation to the running back position itself. It’s not a strategy about ignoring the running back position and hoping to solely run into lottery tickets, it’s an underlying strategy about allocating the majority of your tangible draft capital into the position that requires the most resources — one enhanced by busts and injuries — and by selecting overall higher-scoring players with those spots. Which in turn, is creating a roster strength. By drafting backups who are already higher-scorers at a position you’ve already invested in, you’re not only increasing your potential of consistently maximizing your own lineup for 16 weeks, but you’re also decreasing your opponents’ resources in that area. I don’t always draft WR-heavy — and things such as scoring format and roster settings play a large part when I do — but the reasons stated above are why it’s become an increasingly viable strategy that has gained popularity.
It also helps that the wide receiver position is the one we’re the most successful at remotely forecasting and setting the market during our drafts compared to tight ends and running backs. Wide receivers hold a significant edge in the correlation to average draft position and actual output.
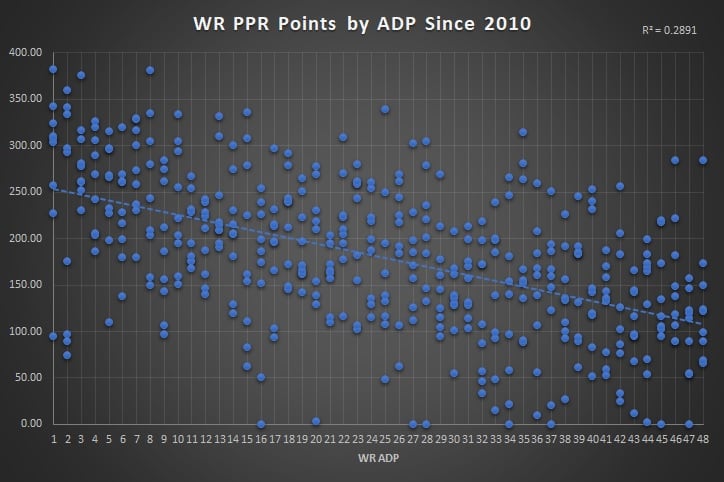
There’s still a solid “pay to play” element when it comes to the highest-scoring receivers, but the crust of the position carries a slightly lower price tag than the running back position, which resembles that limited supply TV sale on Black Friday. While you have to come in and get the top-scoring running backs early, there’s more stability in finding high-scoring opportunities on the secondary and third levels of the wide receiver position as you move throughout your draft. Of the 93 wideouts to reach 250 fantasy points in a season above, 27 of those (29 percent) came from WR20-plus in draft position while 40 of those seasons (43 percent) came from receivers drafted outside of the top-12 at the position.