As we are pushing into July and further downhill toward the 2022 fantasy season, we are going to extend our top-down approach that started with a look at the state of leaguewide production and usage at each skill position for fantasy by looking at team performance and output.
So far, we have dove into scoring and touchdown performance per drive, team touchdown dispersal, and how often teams converted yardage gained into reaching the end zone.
Today, we are going to finish things off with a top-down look at red zone performance across the league and on a team level in search of shining a light on some signals to use for the 2022 season.
League-wide Red Zone Production Since 2010
*All Drives exclude possessions that end in kneel downs
| Year | RZ/Drive | RZ TD% | NFL TD% |
|---|---|---|---|
| 2021 | 31.74% | 58.23% | 77.62% |
| 2020 | 32.92% | 62.00% | 75.87% |
| 2019 | 30.03% | 56.10% | 73.15% |
| 2018 | 29.37% | 58.82% | 74.18% |
| 2017 | 26.78% | 52.42% | 71.36% |
| 2016 | 29.57% | 55.26% | 74.86% |
| 2015 | 27.28% | 55.77% | 72.49% |
| 2014 | 27.91% | 53.28% | 71.86% |
| 2013 | 27.13% | 55.20% | 73.48% |
| 2012 | 27.05% | 53.75% | 72.97% |
| 2011 | 27.30% | 51.98% | 72.31% |
| 2010 | 26.84% | 52.16% | 71.48% |
So far to date, we have spent a section highlighting that the 2021 season followed an NFL season played under extremely unique parameters. As the paradigm shifted, we saw regression in efficiency across the board a year ago compared to the 2020 campaign, but the 2021 season still carried significant scoring prowess across the league compared to the recency of the modern era.
That holds true once again as the number of drives that reached the red zone and red zone touchdown rates dipped off the blistering 2020 pace, but were as high as we have seen in the modern era of the game.
One thing that climbed to new heights was the dependency that teams had on reaching the red zone to produce touchdowns. 77.6% of all touchdowns scored in 2021 came from inside of the red zone, improving on last season’s rate, giving us new highs over the past two seasons on the rate of touchdowns scored as close to the paint as possible.
2021 was also the third consecutive season in which teams reached the end zone on over 30% of their possessions.
If you are wondering why the red zone is so important to us for fantasy football, you can see that that is where the touchdowns are actually scored. It is no secret that the closer you get to the end zone, the easier it is to produce a touchdown, but since 2010, here are some numbers to consider…
- 73.7% of all touchdowns scored have come from inside of the red zone.
- 73.3% of all red zone touchdowns scored come from inside of the 10-yard line.
- 74.0% of all rushing touchdowns and 43.2% of all passing touchdowns scored overall come from inside the 10-yard line.
- 46.9% of all red zone touchdowns are scored from inside the 5-yard line.
- 57.2% of all rushing touchdowns and 22.5% of all passing touchdowns scored overall come from inside the 5-yard line.
- 31.2% of all red zone touchdowns are scored from the 1-2 yard lines.
- 23.0% of all NFL touchdowns are scored from the 1-2 yard lines.
- 43.6% of all rushing touchdowns and 11.9% of all passing touchdowns scored overall come from the 1-2 yard lines.
2021 Team Red Zone Play Splits
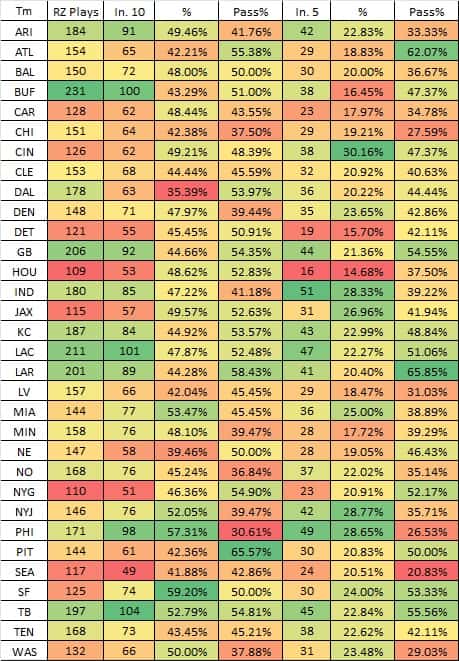
Knowing that all of those red zone plays are not equal, we can take a look at the types of red zone plays teams had a year ago and their playcalling splits in each area of the field.
For example, the Cowboys were ninth in the NFL in red zone plays (178), but just 35.4% of those red zone plays were from inside of the 10-yard line, the lowest rate in the league.
New England was 31st in the NFL in the percentage of red zone plays to come from inside of the 10-yard line and 25th in the rate of red zone plays run inside of the 5-yard line. This played a large role in them kicking a field goal on 21.8% of their possessions, the second-highest rate in the league.
The Raiders led the NFL in the percentage of drives to end in a field goal (22.1%) and were 29th in the league in red zone conversion rate (49.2%) after ranking 29th in the league in the rate of red zone plays run from inside of the 10 (42.0%) and 27th in the rate of red zone plays from inside of the five (18.5%).
The 49ers were 27th in the league in red zone plays (127), but 59.2% of those plays came from inside of the 10 (first) and 24.0% from inside of the five (seventh), which played a role in their 64.4% red zone conversion rate, which was fourth in the league.
PLAY SPLITS NOTES
Teams also call different games than others in each section of the field, something that is important during the season from a DFS stance.
The most notable switch from a year ago came from the Rams, which directly correlates to their acquisition of Matthew Stafford and their historic dependency on passing scores a year ago.
Los Angeles threw the ball 58.4% of the time inside of the 10 (second) and 65.9% of the time inside of the five (first). Here is how that compared to the previous seasons under Sean McVay.
Rams Passing Rates Inside of the Red Zone Under Sean McVay
| Year | RZ | In. 10 | In. 5 |
|---|---|---|---|
| 2021 | 59.20% | 58.40% | 65.85% |
| 2020 | 38.82% | 26.83% | 30.43% |
| 2019 | 47.40% | 36.36% | 31.25% |
| 2018 | 52.08% | 44.83% | 30.56% |
| 2017 | 50.31% | 44.12% | 35.48% |
While the Rams carried some aggressiveness in the red zone in the early years of Jared Goff, you can see how much the addition of Stafford altered that aggression and confidence in the passing game, especially inside of the 5-yard line. This is how Stafford threw 13 touchdowns inside of the five (second to only Tom Brady’s 16) and Cooper Kupp was tied for the league lead with five touchdown grabs from that area of the field. I still believe the Rams are a good bet to have a more balanced distribution of how their touchdowns are scored in 2022, but this was a major shift in approach after the addition of Stafford.
On the flip side, you can see how the Eagles led the NFL in rushing touchdowns a year ago as they ranked 32nd in the league in passing rate inside of the 10 and 31st inside of the five paired with ranking fourth and second in the league in plays from those areas of the field.
WHO NEEDED THE RED ZONE TO SCORE
No team needed the red zone to score touchdowns less than the Bengals. Just 59.6% of their touchdowns were scored from inside of the red zone, which played a large role in the Bengals ranking 26th in the league in plays from inside of the red zone.
Cincinnati scored 21 touchdowns from outside of the red zone, tied for the third-most by a team in the 2000s. No team has scored 20 or more touchdowns from outside of the red zone in back-to-back seasons over that timeframe.
Of the previous 35 teams to score fewer than 60% of their offensive touchdowns from outside of the red zone, all 35 needed the red zone more the following season, seeing an average increase of 18.5% of their touchdowns coming from the red zone the next season. 33 of those teams scored more red zone touchdowns the following season, with an average increase of 9.3 red zone touchdowns among those teams.
It is hard to suggest that Joe Mixon can greatly improve on his 16 touchdowns from a year ago, but the Bengals are a bet to score more touchdowns closer to the end zone in 2022 and he would stand as the largest beneficiary in that department.
The Lions (40%), Texans (37.9%), and Seahawks (35.4%) were the other teams that scored over a third of their touchdowns from outside of the red zone. 91.3% of the teams that relied on scoring from long range to that degree in the 2000s came back and scored a higher rate of their touchdowns from inside of the red zone. 68% of those teams also scored more red zone touchdowns overall, with an average increase of 8.9 more red zone touchdowns among those teams.
On the other end of things, no team struggled to generate big-play touchdowns like the Falcons last season. Atlanta scored just twice all season from outside of the red zone, the fewest in a season since the 2013 Ravens.
93.6% of their touchdowns came from inside the red zone, the highest rate for a team since Washington in 2004, and the third-highest rate of the 2000s.
The Dolphins have been on some run here in failing to create splash-play scores, ranking 31st (three), 32nd (five), and 29th (six) in touchdowns scored outside of the red zone those seasons.
It has clearly been a point of emphasis for Miami to address their explosive play ability this offseason. Tyreek Hill has scored 40 career touchdowns from outside of the red zone since entering the NFL in 2016, the most in the league. The next closest player has 28.
Not just Hill, but Chase Edmonds has scored 35.7% of his career touchdowns from outside of the red zone, while Raheem Mostert (50%), and Cedrick Wilson (62.5%) have scored half or more of their touchdowns from outside of the red zone. Regardless of how much blame you put on Tua Tagovailoa for contributing to the lack of big plays, the Dolphins have completely revamped their personnel in aiding this team turning things around in scoring some lengthy touchdowns in 2022.
2021 TEAM RED ZONE RATES
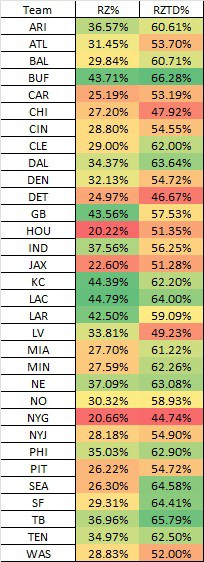
Closing things up, here are team rates in the percentage of drives to reach the red zone and the conversion rate for red zone possessions into touchdowns.
No team reached the red zone on a higher rate of drives than the Chargers last season at 44.8%. Not only was that the highest rate of drives to reach the red zone in 2021, but it was also the highest rate of the 2000s, besting the 2007 Patriots (44.6%). Brandon Staley’s aggressiveness played a role here, while no player benefited from the red zone a year ago more than Austin Ekeler.
Ekeler led all non-quarterbacks with 163.1 PPR fantasy points in the red zone. The next closest player was Cooper Kupp with 124.0. Check out that production near the paint compared to his career previously.
Austin Ekeler Red Zone PPR Points
| Year | PPR Pts. |
|---|---|
| 2021 | 163.1 |
| 2020 | 36.1 |
| 2019 | 60.8 |
| 2018 | 34.9 |
| 2017 | 13.8 |
In the 2000s, 15 other teams have reached the red zone on 40% of their drives or more. Of those teams, all but two reached the red zone at a lower rate the following season while all but one scored fewer offensive touchdowns. While this is a spot to highlight natural regression for a team and a player that were at the top of their game, the silver lining is that the two teams to actually outproduce their red zone rate the following season came a year ago with the Bills and Packers.
Joining the Chargers, Bills, and Packers in reaching the red zone on 40% or more of their possessions was the Chiefs at 44.4%. That mark was good for the third-highest rate of the 2000s. If there is a testament to how much the game has changed in terms of offensive efficiency, four of the top 10 seasons in red zone rate per drive came in 2021 from these four teams.
In the opening of this series, we highlighted how the Chiefs are the first team to ever score on 50% or more of their drives in four straight seasons. They have been able to sustain that due to ranking third or higher in red zone rate per drive in all four of those years.
The Rams were the fifth team to reach the red zone on over 40% of their drives (42.5%), coming off of a 32.9% (17th) rate in 2020, which forced their hand in pursuing Matthew Stafford.
While the 2021 season gave us the most teams in a season reaching the red zone with elite frequency, we still had some stinkers. The Lions (24.9%), Jaguars (22.6%), Giants (20.7%), and Texans (20.2%) all reached the red zone on less than 25% of their drives. As highlighted earlier, the Lions and Texans at least scored a respectable number of touchdowns from outside of the red zone, but the Jaguars and Giants were just a factory of offensive sadness.
On a potential uplifting note for these offenses, 78% of the teams since 2010 to reach the red zone on less than 25% of their drives improved the following season with an average increase of 6.7% and eight more red zone touchdowns per game.
Reaching the red zone is half the battle. Finishing those drives with touchdowns is the second part.
The good thing is in terms of red zone conversion rate, we actually did not have any historic outliers like in previous seasons with teams like the Titans.
The Bills led the way here in converting 66.3% of their red zone trips for touchdowns. That paced the 2021 season, but also checks in 28th overall among seasons since 2010.
If you want to still apply modern regression here, there have been 97 teams to score a touchdown on 60% or more of their red zone possessions since 2010. 74 (76.3%) of those teams had a decrease in red zone touchdown rate the following season with an average loss of 11.4%. among those teams. Those teams averaged over 0.5 red zone touchdowns per game in those following seasons. This was nearly half of the league in 2021.
On the other end of the spectrum, of the 84 teams to convert less than 50% of the time in the red zone since 2010, 70 of them (83.3%) converted at a higher rate the following season with an average increase of 12.4% and 8.5 more red zone touchdowns per team.
If looking for a dead cat bounce here, the Raiders, Bears, Lions, and Giants all fit that criteria from a year ago.